Figure 1.

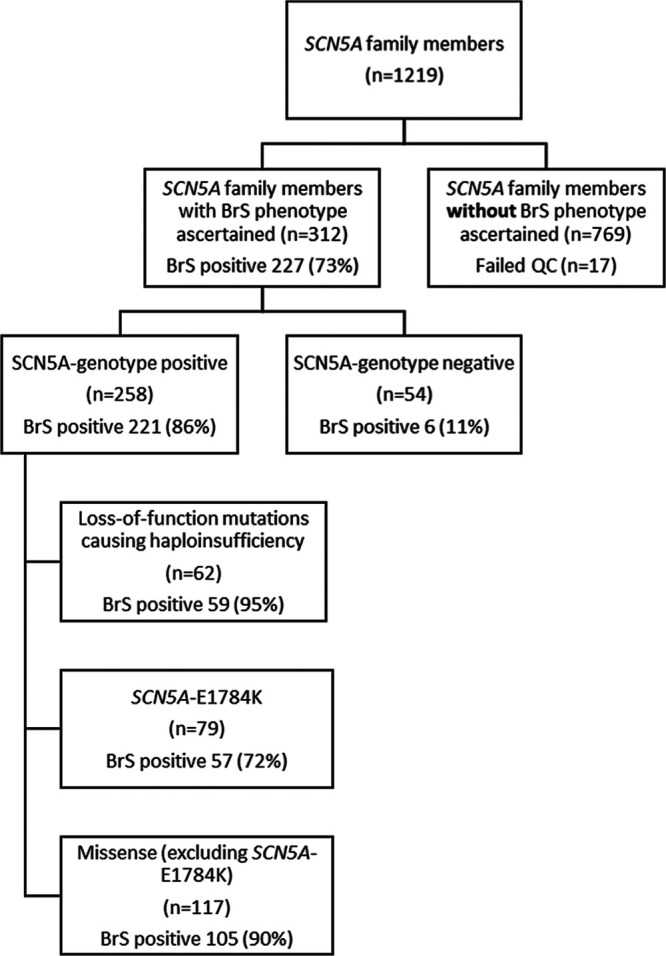
Flow diagram summarizing inclusion and numbers of individuals separated by genotype and Brugada syndrome (BrS) phenotype in each cohort.

Flow diagram summarizing inclusion and numbers of individuals separated by genotype and Brugada syndrome (BrS) phenotype in each cohort.