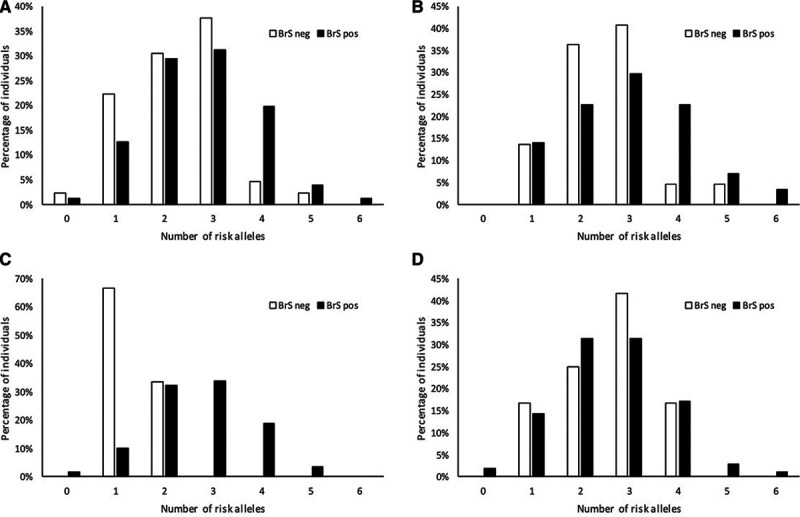
Figure 3.

Cumulative number of risk alleles at the 3 loci and the associated likelihood of Brugada Syndrome (BrS) phenotype showing performance of the BrS-genetic risk score for prediction of BrS phenotype in mutation positive individuals.A, Total cohort; (B) individuals harboring E1784K-SCN5A; (C) individuals harboring loss-of-function SCN5A mutations causing haploinsufficiency; (D) individuals harboring other missense SCN5A mutations. Distribution of numbers of risk alleles hosted by individuals with BrS phenotype (black bars) in each cohort are shown vs family members ascertained to be BrS phenotype-negative (white bars). Each bar represents the proportion of individuals carrying the corresponding number of risk alleles as a percentage of the total number of individuals with the corresponding phenotype, that is, denominator for the white bars being the total number of individuals with no BrS within the cohort, and the denominator for the black bars being the total number of individuals with BrS within the cohort.
