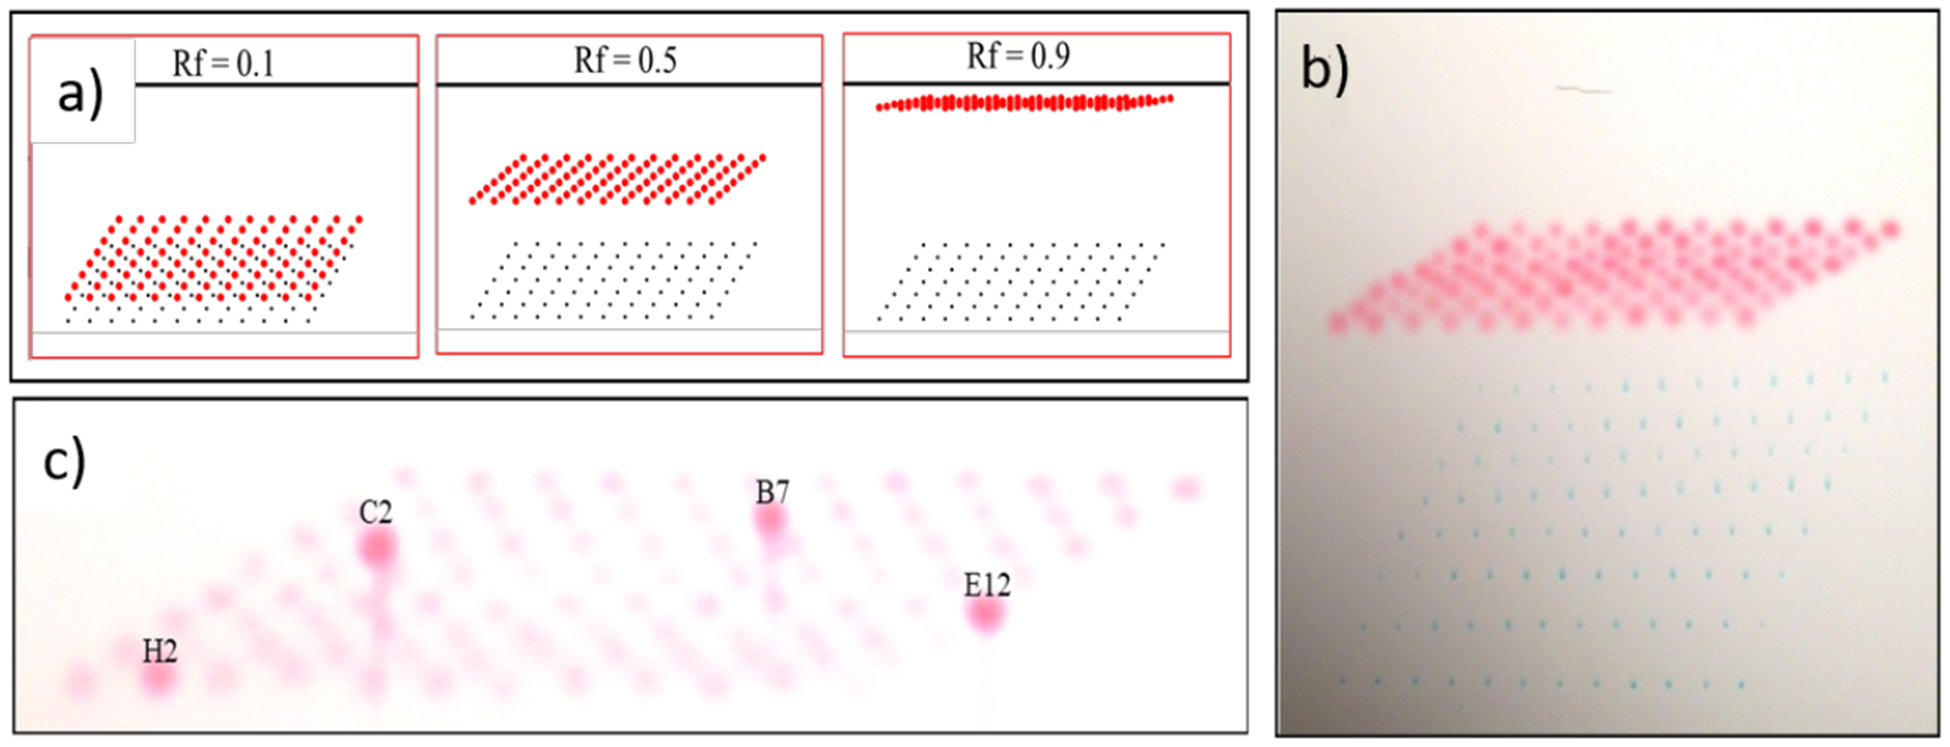
Figure 2.

Modeling and initial studies using dyes from multi-parallel from microplates spotted on TLC plates using a staggered spotting approach. a) Excel modeling showing ‘sweet spot’ of Rf ~0.5 for most effective visualization. b) Elution of spots from a 96-well plate containing samples of methylene blue (Rf ~0) and methyl red (Rf ~0.6) using 95% ethanol/water. c) Analysis of plate, not eluted, containing 4 wells spiked with additional methyl red allows easy determination of the ‘address’ of the hits.
