
Figure 4.
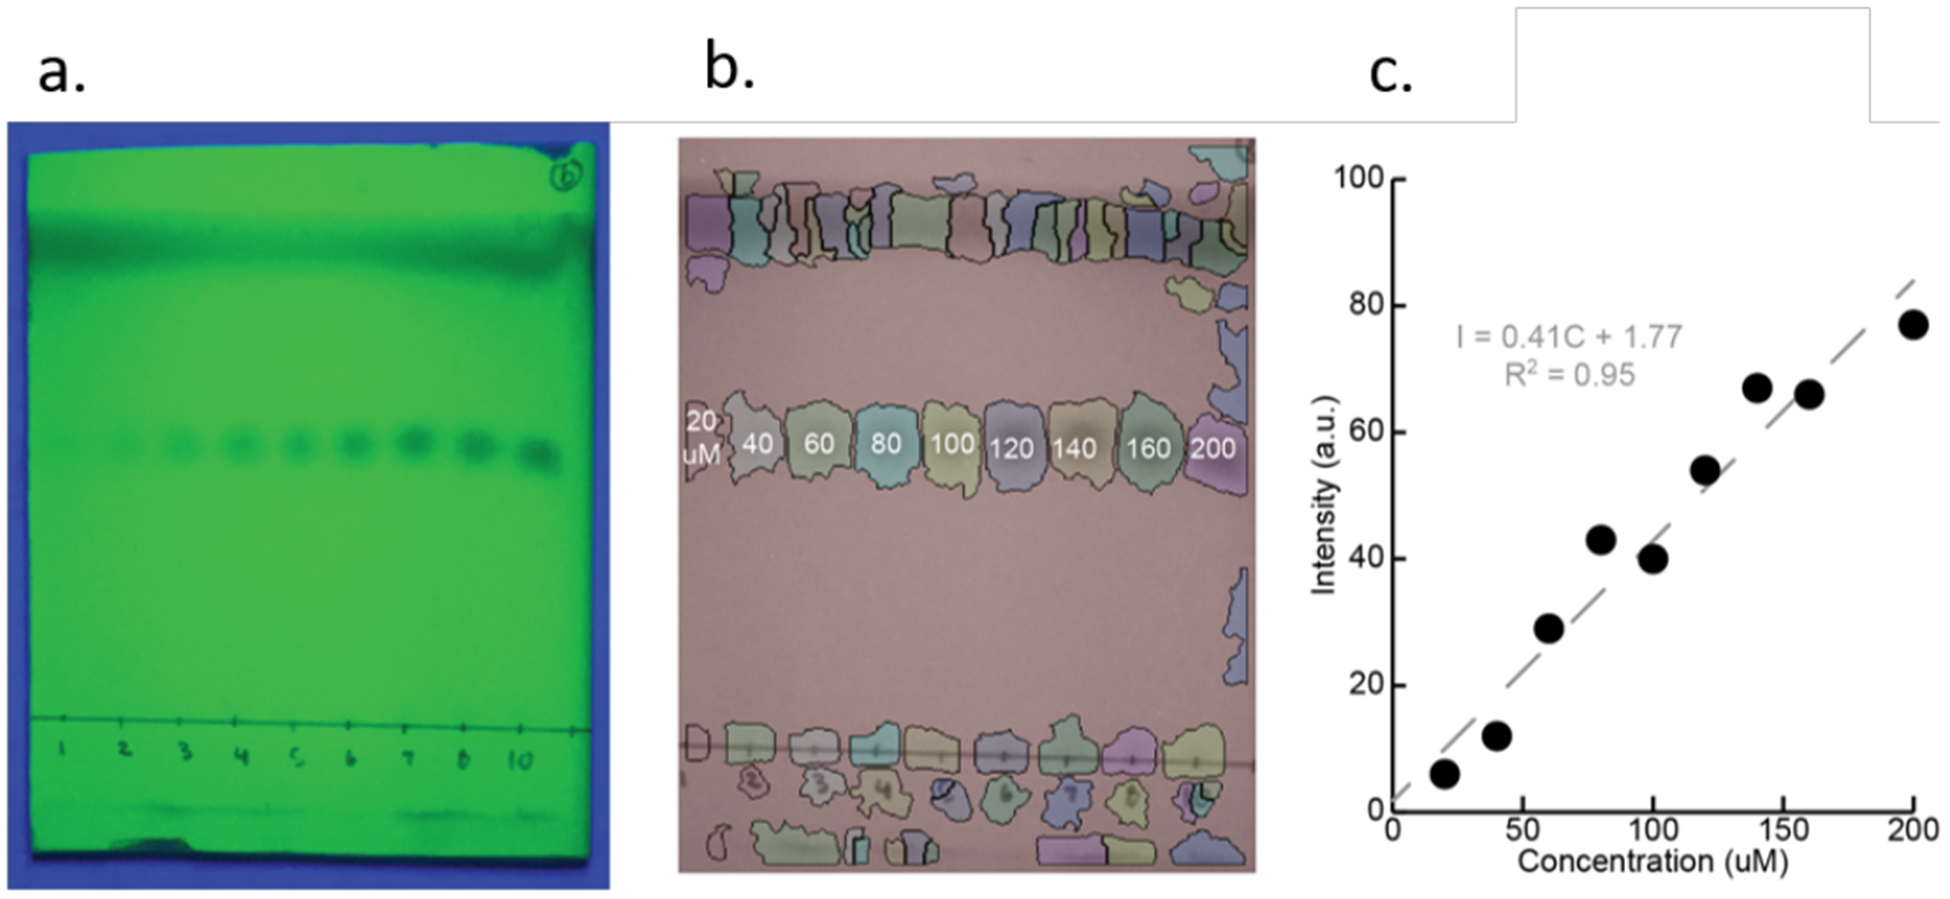
a) A calibration plate is spotted with known concentrations of analyte 1 and eluted. b) Eluted spots are segmented and their intensities are quantified. Loading concentration of each reaction is indicated in μM. c) A linear calibration curve (R2 = 0.95) generated from varying concentration of 1.