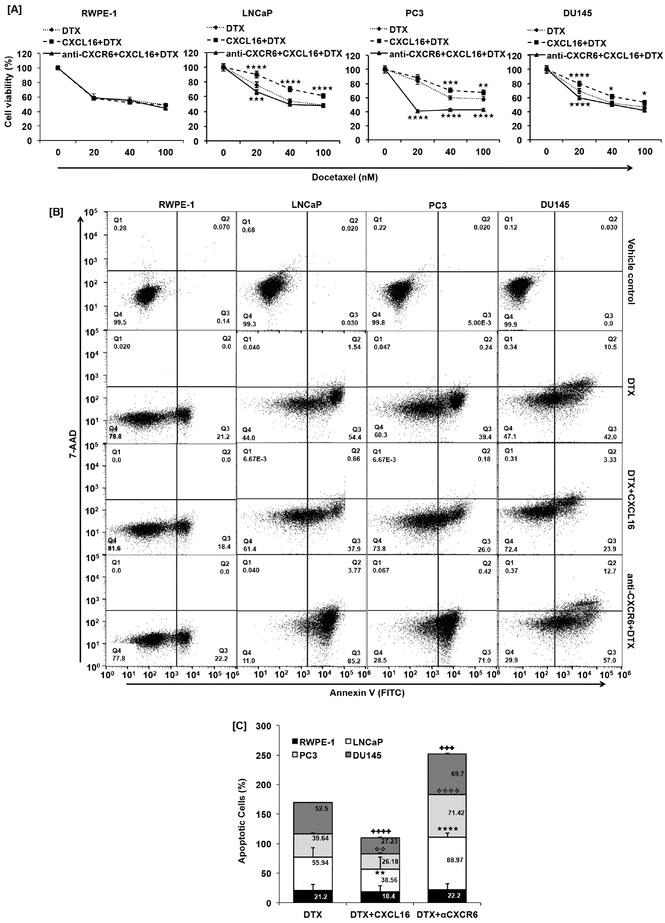
Figure 1. Effect of CXCR6 stimulation and blockade on DTX induced cell death.
PCa cells (LNCaP, PC3 and DU145) and non-cancerous immortalized human prostate cell line (RWPE-1) cells treated with different concentration (0-100nM) of DTX ( ) CXCL16 (100ng/ml) + DTX (
 ); anti-CXCR6 (1μg/ml) + CXCL16 (100ng/ml) + DTX (
 ) for 48h, cell viability assay show effect of CXCR6-CXCL16 axis on DTX (Panel-A). Statistical significance between DTX alone vs. combination treatment group was done using 2-way ANOVA multiple comparison test represented as asterisks (★, p≤0.05; ★★, p≤0.01; ★★★, p≤0.001; ★★★★, p≤0.0001). Apoptosis induced by DTX (40nM), in presence or absence of CXCL16 (100ng/ml), with or without CXCR6 blockade (1μg/ml) was quantified by FACS (Panel-B). DMSO treated cells were used as a vehicle control. Quadrate (Q2) and Q3 show late and early apoptotic cells. Clustered stacked column chart is a quantitative representation of the percentage death in RWPE-1 (■), LNCaP (□), PC3 (■), and DU145 (■) cells (Panel-C). Values are mean ± SEM from three independent experiments. Statistical significance between combination treatment group and DTX alone, was done by Student’s t-test. Statistical difference is represented as ★★, p≤0.01 between DTX alone and CXCL16 + DTX; ★★★★, p≤0.0001 between DTX and anti-CXCR6 + DTX for LNCaP cells; ❖❖, p≤0.01 between DTX alone and CXCL16 + DTX; ❖❖❖❖, p≤0.0001 between DTX and anti-CXCR6 + DTX for PC3 cells and,
  , p≤0.0001 between DTX alone and CXCL16 + DTX;
  , p≤0.0005 between DTX and anti-CXCR6 + DTX for DU145 cells.

