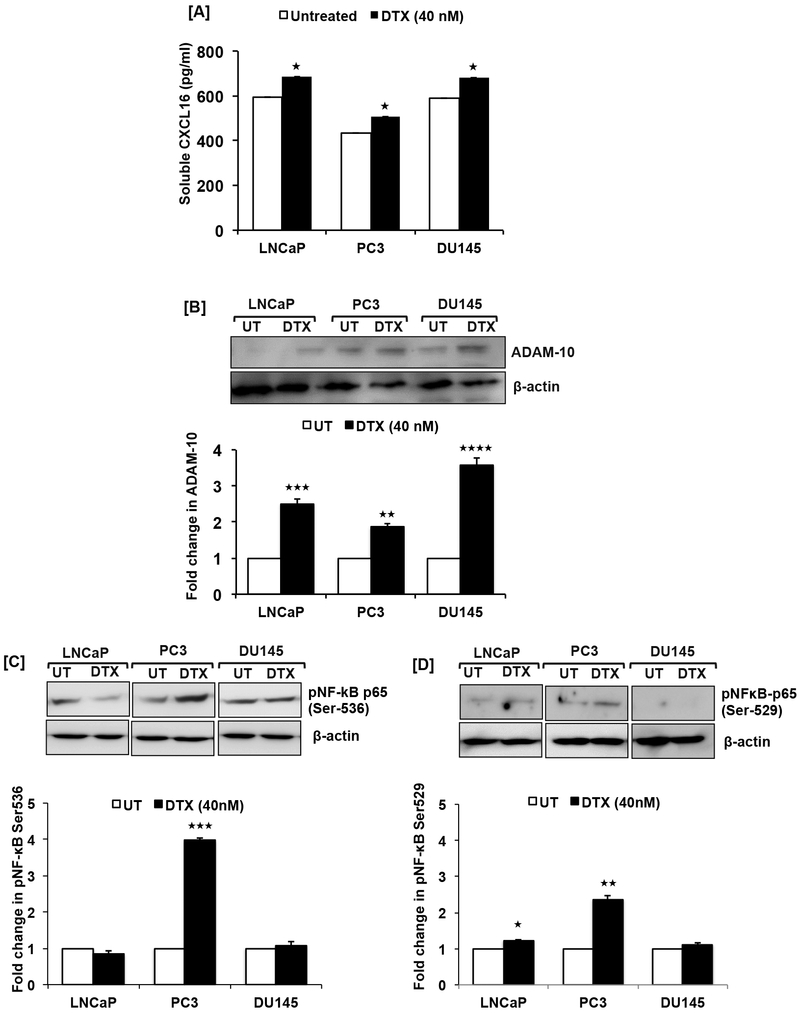
Figure 3. Docetaxel induced cleavage of CXCL16, ADAM-10 expression and NF-κB activation in prostate cancer cells.
ELISA showing soluble CXCL16 levels in conditioned media of LNCaP, PC3, DU145 treated with DTX (40nM) for 48h compared to untreated control (Panel-A). Values are mean ± SEM from three independent experiments. Multiple t-test using the Holm-Sidak method was used to test the significance, asterisks (★, p≤0.05) show statistically significant difference between treated and untreated control. Representative western blot images showing ADAM-10 expression in LNCaP, PC3 and DU145 48h after DTX (40nM) treatment (Panel-B). Quantified band intensity represents fold change in ADAM-10 expression after normalization with β-actin in the bar graph. Asterisks (★★, p≤0.01, ★★★, p≤0.001, ★★★★, p≤0.0001) show statistically significant difference between treated and untreated control. Phosphorylation of NF-κB at Ser-536 (Panel-C) and Ser-529 (Panel-D) in PCa cells (LNCaP, PC3 and DU145) treated with DTX (40nM) for 48h compared to control. Asterisks (★, p≤0.05, ★★, p≤0.01, ★★★, p≤0.001) statistically significant show difference between treated and untreated control.

