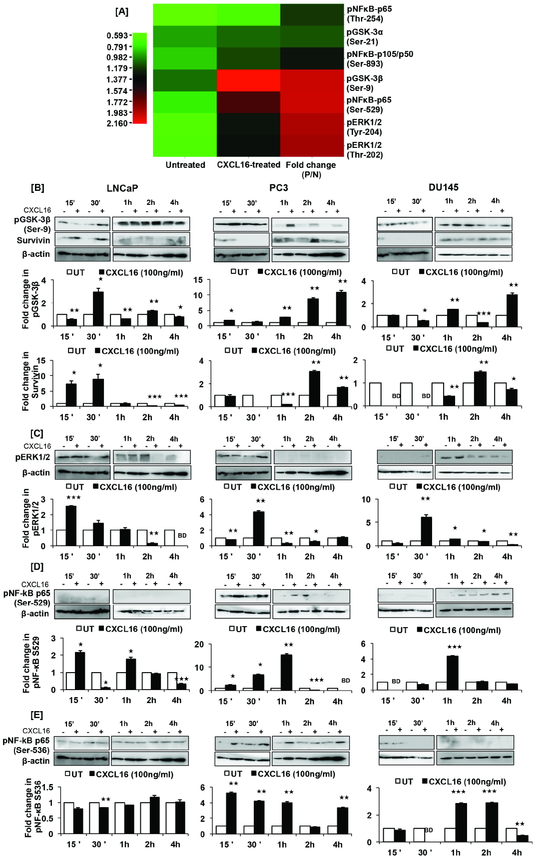
Figure 4. CXCL16 induced molecular signals responsible for undermining cytotoxic effect of DTX on PCa cells.
Heat map shows phosphorylation status of signaling molecules in PCa cells 15 minutes after CXCL16 treatment (Panel-A). Phosphorylated to unphosphorylated protein (P/N) ratios were calculated from the intensity values. Intensity of red represents increase and green represents decrease in phosphorylation as shown in the intensity bar below the hear map. Change in phosphorylation status of GSK-3β(Ser-9), ERK1/2(Thr-202/Tyr-204), NF-κB-p65(Ser-529), NF-κB-p65(Ser-536) are shown in Panel-B, -C, -D and E; change in survivin expression in LNCaP, PC3 and DU145 cells treated with CXCL16 is also shown in Panel-B. Band intensity was quantified by imageJ and normalization with β-actin. Fold change in expression or phosphorylation is shown in bar graph. Asterisks represent statistically significant difference (★, p≤0.05, ★★, p≤0.01, ★★★, p≤0.001) between treated and untreated control. Same loading control was used for the blots, which were stripped and re-probed with another antibody.

