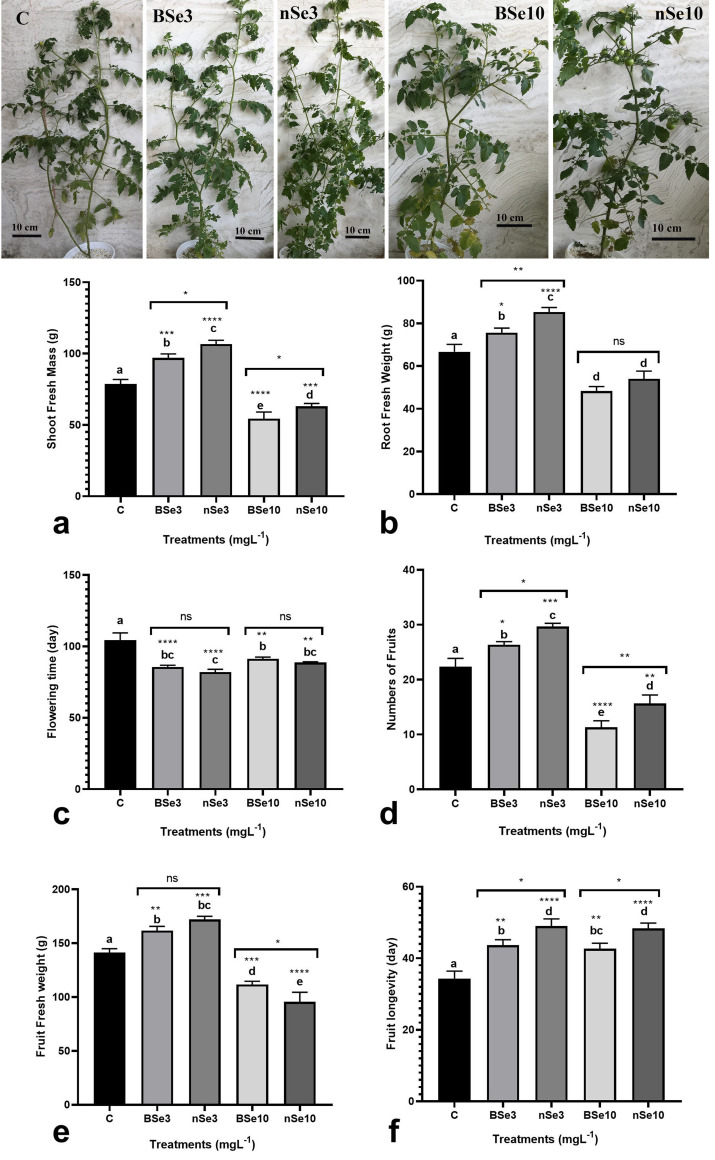
Fig 1.
Variations in shoot and root biomass (a, b), flowering time (c), numbers of produced fruits (d), fruit biomass (e), and fruit postharvest longevity (f) in response to foliar application of BSe or nSe. Data are Mean ± standard deviation (SD) of three independent replications (n = 3). Treatment groups: C- Control; BSe3- Bulk Se at 3 mgl-1; nSe3- nSe at 3 mgl-1; BSe10- Bulk Se at 10 mgl-1; nSe10- nSe at 10 mgl-1; Different letters on top of columns refer statistically significant difference according to the Tukey's multiple comparisons test. ns: non-significant; *: 0.01<p≤0.05; **: 0.001<p≤0.01; ***: 0.0001<p≤0.001; ****: p≤0.0001. The asterisk on each column indicates a p-value level for comparing the mean of each group with the control group. Additionally, a comparison between the two Se groups at the same concentration is displayed by placing an asterisk (*) on the line.

