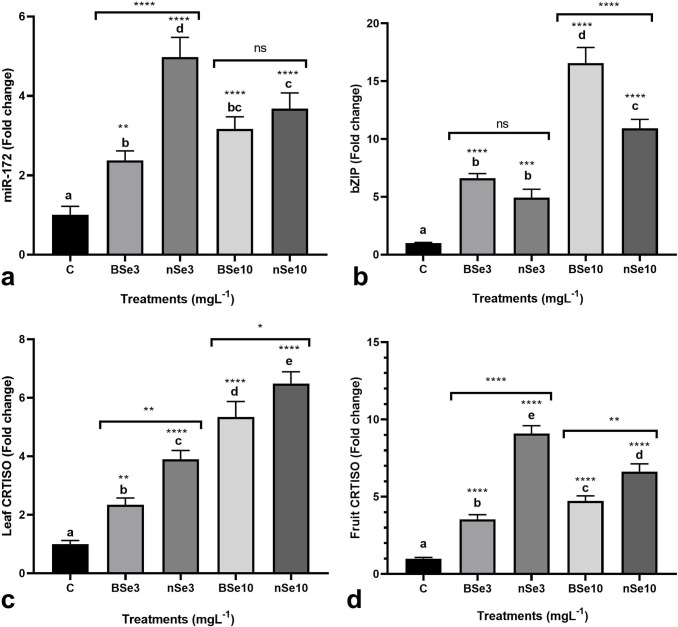
Fig 2.
BSe or nSe-mediated transcriptional changes in leaf miR172 (a), leaf bZIP transcription factor (b), leaf CRTISO (c), and fruit CRTISO (d); Data are Mean ± standard deviation (SD) of three independent replications (n = 3). Treatment groups: C- Control; BSe3- Bulk Se at 3 mgl-1; nSe3- nSe at 3 mgl-1; BSe10- Bulk Se at 10 mgl-1; nSe10- nSe at 10 mgl-1; Different letters on top of columns refer statistically significant difference according to the Tukey's multiple comparisons test. ns: non-significant; *: 0.01<p≤0.05; **: 0.001<p≤0.01; ***: 0.0001<p≤0.001; ****: p≤0.0001. The asterisk on each column indicates a p-value level for comparing the mean of each group with the control group. Additionally, a comparison between the two Se groups at the same concentration is displayed by placing an asterisk (*) on the line.

