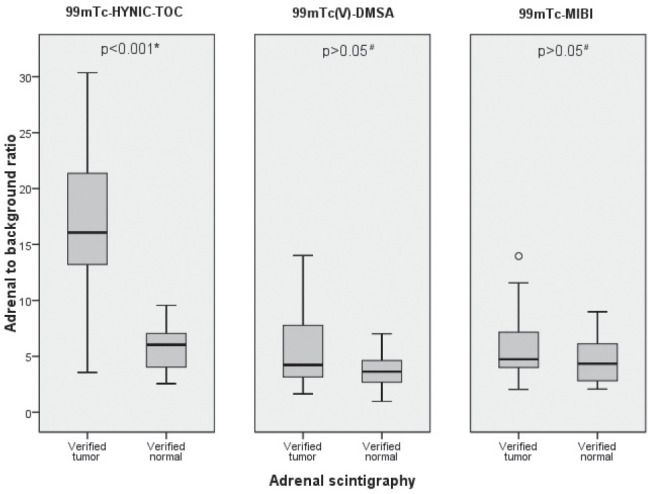
Figure 3.

Distribution of adrenal/background ratios in the 3 studied groups revealing a statistically significant difference (t-test for independent samples*) only with 99mTc-HYNIC-TOC SPECT between adrenal tumors (n=50) and the control group (n=23).
