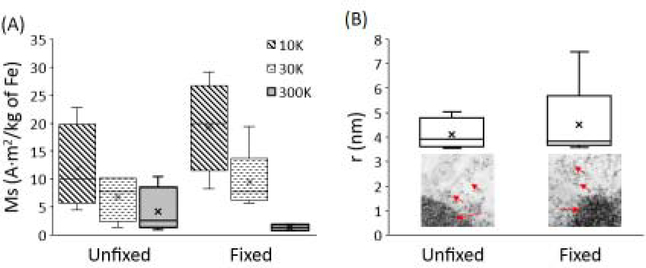
Figure 3:
(A) Saturation magnetization (Ms) ascertained using M-H curves at respective temperatures. (B) Average particle size from Langevin fitting of M-H graphs. Inset: TEM images of electron dense ferritin particles (red arrows) in/near the lysosomes in cells. No significant difference between fixed versus unfixed samples were found in any of these parameters (p>0.01).

