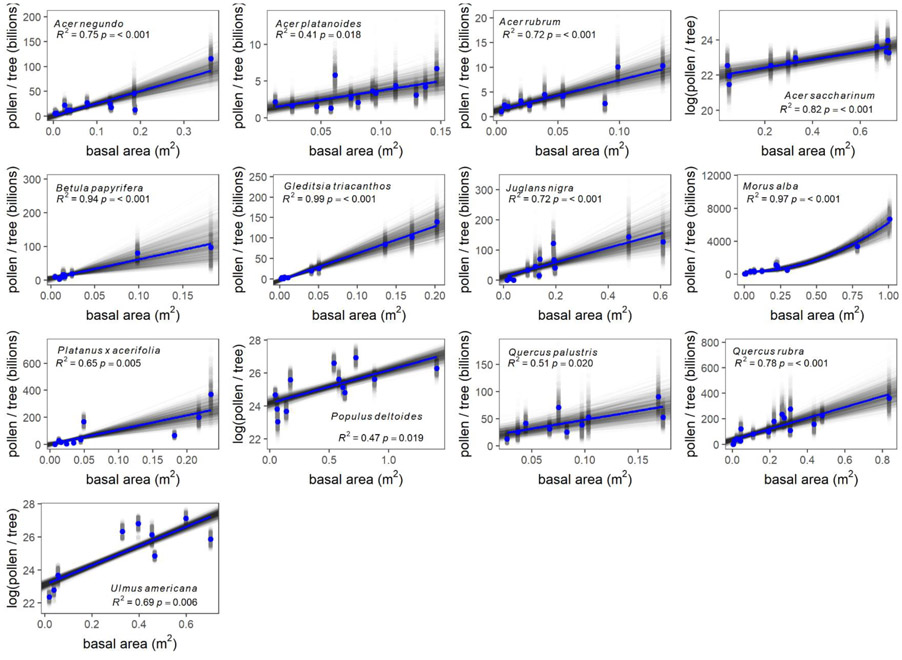
Fig. 3.
Pollen grains per tree as a function of tree basal area for each species. Estimates of pollen production for individual trees from each bootstrap iteration are provided in gray and the mean for each tree is provided in blue; this color scheme is also used for regressions. Note that axes scales vary between species.

