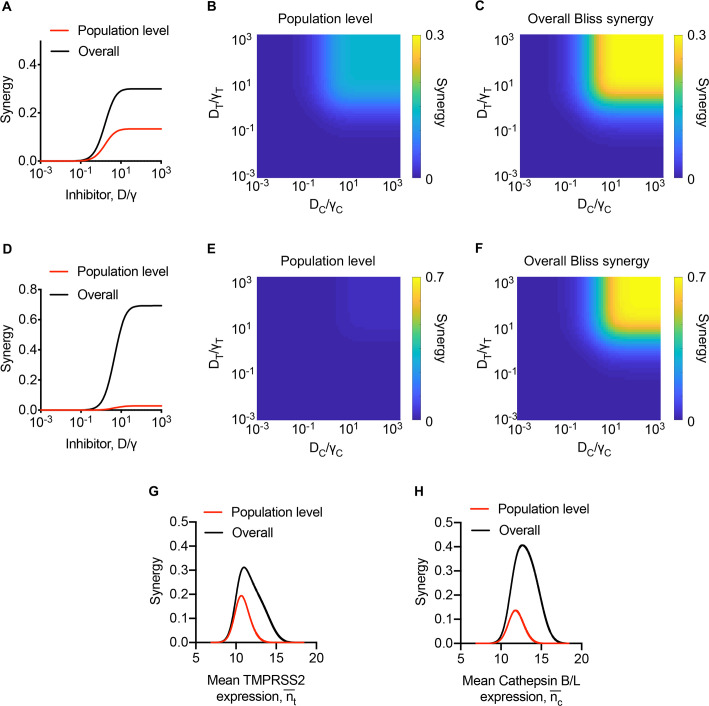
Fig 5. Predictions of population level synergy.
(A-F) The predicted population level and overall synergy over a range of drug concentrations (see text for details). (G, H) The predicted overall and population level synergy for varying mean TMPRSS2 expression and fixed mean ( = 11.5) Cathepsin B/L expression (G) and for varying mean Cathepsin B/L expression and fixed mean ( = 11.5) TMPRSS2 expression at two different drug concentrations (H). The drug concentrations were normalised by the respective γ values. In A-C and G-H, = 1.2 x 10⁵ copies/cell and = 2.4 x 10⁵ copies/cell. In D-F, = 4 x 10⁴ copies/cell, = 4 x 10⁴ copies/cell. In G-H, DT/γT = DC/γC = 10. The parameters are listed in S1 Table.

