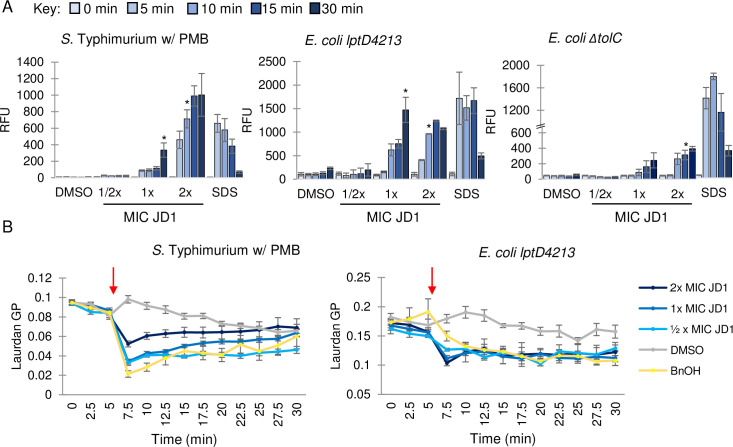
Fig 5. JD1 perturbs membrane barrier function and fluidizes membranes.
A) Cell membrane permeability was monitored by PI fluorescence for S. Typhimurium in LB with 0.5 μg/mL PMB, and the E. coli lptD4213 and ΔtolC mutant strains in LB. Cells were treated at time 0 with the corresponding MIC95 concentration of JD1 (Table 1) or with DMSO or 0.008% SDS and samples were processed at the timepoints shown. Average and SEM of three biological replicates performed with technical triplicates. Asterisks indicate the first time point of JD1 treatment that resulted in a significant increase in PI fluorescence; all time points after the asterisk were also significant. * P ≤0.05 as determined by ANOVA. B) Membrane fluidity as monitored by laurdan generalized polarization (GP) for S. Typhimurium in LB with 0.5 μg/mL PMB, and the E. coli lptD4213 mutant strain in LB. Cells were treated at the time indicated (red arrow) with DMSO, benzyl alcohol (BnOH) (50 mM), or the corresponding MIC95 concentration of JD1 (Table 1). Average and SEM of three biological replicates performed with technical triplicates.

