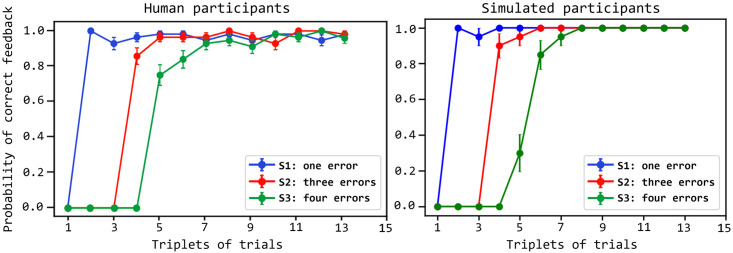
Fig 4. Comparison of the performance of the human and simulated participants.
The performance (y-axis) is measured as the proportion of correct feedback over the trial triplets (x-axis), plotted separately for the three different colour stimuli (S1, S2, S3). Curves indicate the values averaged over 14 human participants and 20 simulated participants; error bars indicate the standard error. The data of human participants are from [48].

