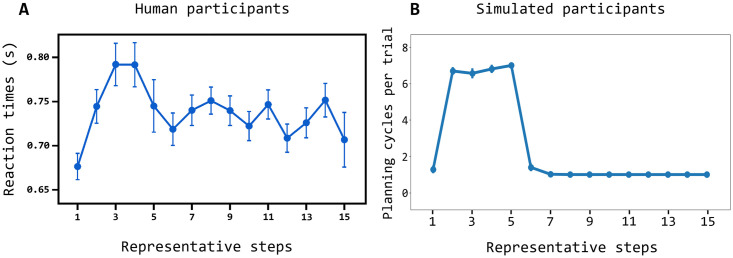
Fig 5. Comparison of the reaction times of the humans and simulated participants.
(A) Reaction times of human participants averaged over S1, S2, and S3 (y-axis) for the ‘representative steps’ ([48]; x-axis); the ‘representative steps’ allow the alignment of the reaction times of the three stimuli so as to separate the exploration phase (first 5 steps) and the exploitation phase (6 steps onward); to this purpose, the reaction times for S1 obtained in succeeding trials from the first onward is assigned the steps (used to compute the averages shown in the plot) ‘1, 2, 6, 7, …’, whereas S2 is assigned the steps ‘1, 2, 3, 4, 6, 7, …’, and S3 is assigned the steps ‘1, 2, 3, 4, 5, 6, 7, …’; data are taken from [48]; (B) Reaction times of the model, measured as number of planning cycles performed in each trial, plotted in the same way as done for humans. Error bars indicate mean standard errors.

