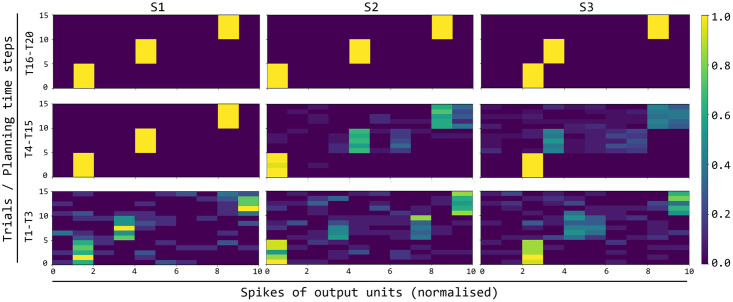
Fig 7. Evolution during trials of the activation of the output layer units encoding the predicted observations and actions.
The three columns of graphs refer to the three colour stimuli; the three rows of graphs correspond to different succeeding sets of trials of the task (T1-T3, T4-T15, T16-T20). Each of the nine graphs shows the activation of the 10 output units (x-axis: units 1-3 encode the three colours, units 4-8 encode the 5 actions, and units 9-10 encode the correct/incorrect feedback) during the 15 steps of each trial (y-axis). The colour of the cells in each graph indicates the activation (normalised in [0, 1]) of the corresponding unit, averaged over the graph trials (e.g., T1-T3) and the planning cycles performed within such trials.

