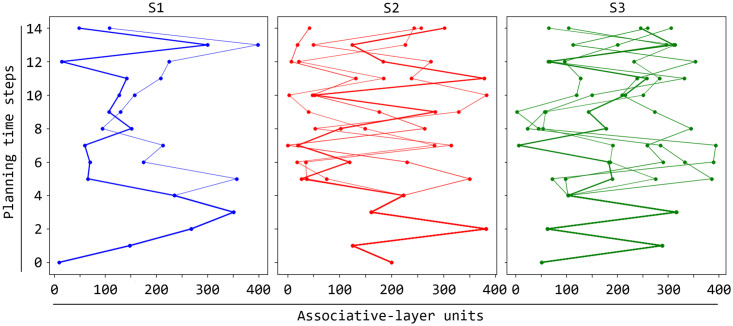
Fig 8. Possible neural trajectories simulated by the model during planning.
The three graphs show different neural trajectories that the associative component can generate for respectively the three colours S1, S2, and S3. For each graph, the x-axes indicates the associative neurons and the y-axis the planning time steps and a dot indicates that the corresponding neuron was active. The bolder curve within each graph marks the correct trajectory for the pursued goal ‘correct feedback’.

