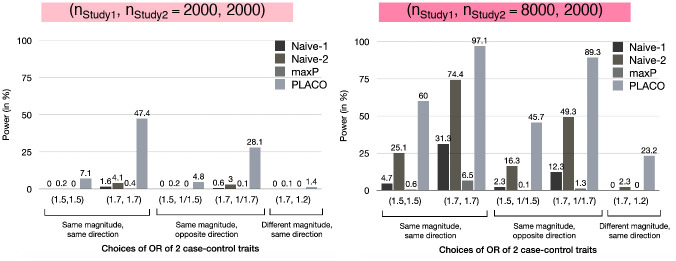
Fig 3. Scenario I: Power of PLACO, maxP and naive approaches at genome-wide significance level (5 × 10⁻⁸) for varying genetic effects of traits from 2 independent case-control studies.
Sobel’s approch is excluded from this figure since it has <1% power across all scenarios. The first naive approach (‘Naive-1’) declares pleiotropic association when pTrait1<5 × 10⁻⁸ and pTrait2<5 × 10⁻⁵, while the second naive approach (‘Naive-2’) uses a more liberal criterion pTrait1<5 × 10⁻⁸ and pTrait2<5 × 10⁻³. Each study either has 1, 000 unrelated cases and 1, 000 unrelated controls, or Study 1 has 4 times sample size as Study 2, where Study 2 has 1, 000 unrelated cases and 1, 000 unrelated controls.

