
Fig 4. Manhattan plot of the PLACO p-values of pleiotropic association of common genetic variants with outcomes (traits) T2D and PrCa.
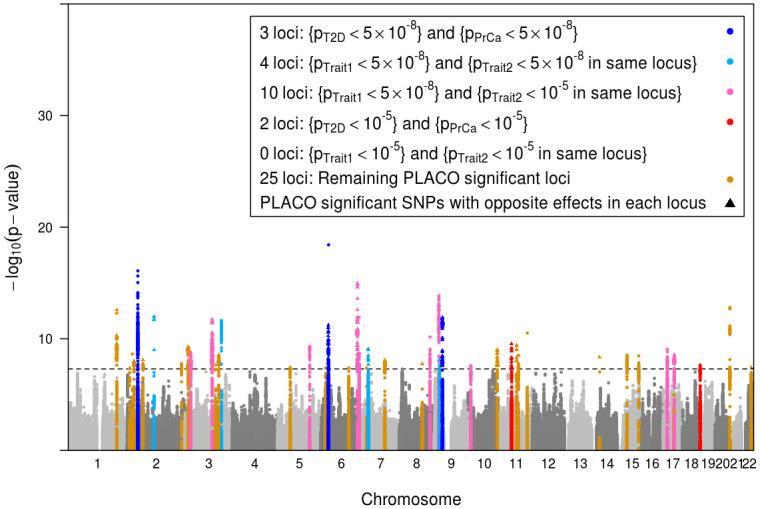
The black horizontal dashed line corresponds to genome-wide significance level α = 5 × 10⁻⁸. The 44 loci with genome-wide significant pleiotropic lead SNP have been highlighted. A locus is defined by clumping SNPs in ±500 Kb radius around the lead SNP and with LD r2>0.2. Within each locus, if a PLACO significant SNP has genetic effects in opposite directions for T2D and PrCa, it is plotted as a solid triangle (24 such loci), else as a solid circle. Each identified pleiotropic locus is categorized (color-coded) as follows. Three loci harbor SNPs that are marginally genome-wide significant for both T2D and PrCa (single-trait p<5 × 10⁻⁸). Four loci contain SNPs that are marginally genome-wide significant for one disease, and in close proximity (i.e., in the same locus) with another SNP marginally genome-wide significant for the other disease. There are 10 loci where SNPs are marginally genome-wide significant for one disease and in close proximity with another SNP marginally suggestively significant (single-trait p<10−5) for the other disease. Two loci harbor SNPs that are marginally suggestively significant (but not genome-wide significant) for both T2D and PrCa. There is no locus that contains SNPs that are marginally suggestively significant (but not genome-wide significant) for one disease, and in close proximity with another SNP marginally suggestively significant (but not genome-wide significant) for the other disease. The rest of the 25 loci identified by PLACO contain SNPs that are not even marginally suggestively significant for either T2D or PrCa.