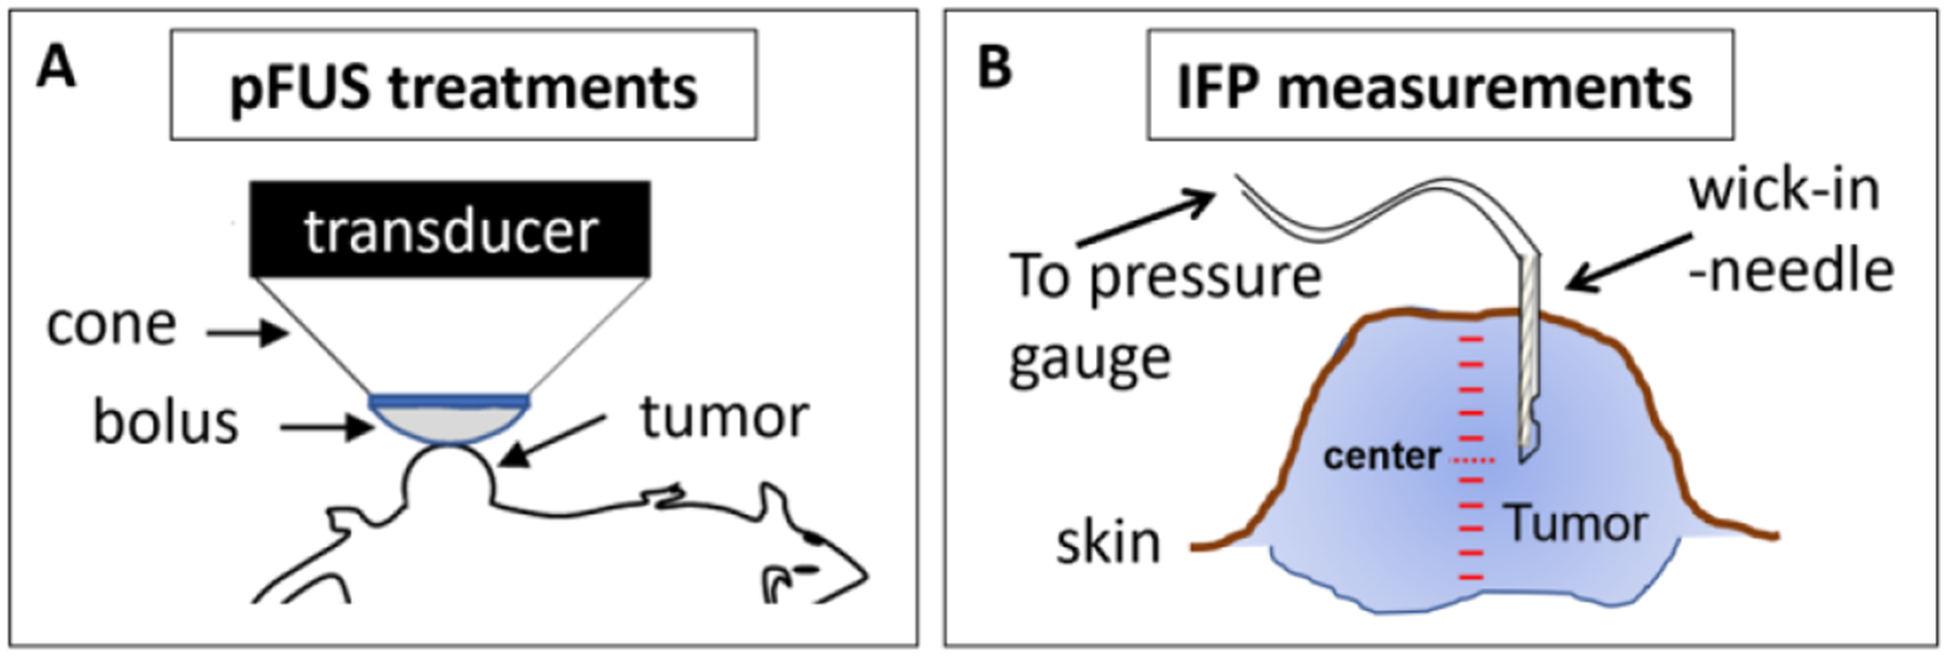
Figure 1.

pFUS treatments and IFP measurements in the tumors. (A) Schematic describing how the pFUS transducer is coupled to the tumor using a water filled cone and flexible membrane (bolus). (B) Schematic indicating the manner by which IFP measurements were performed. Measurements were taken at 0.5 mm increments from the outer surface of the tumors to the most inner surface.
