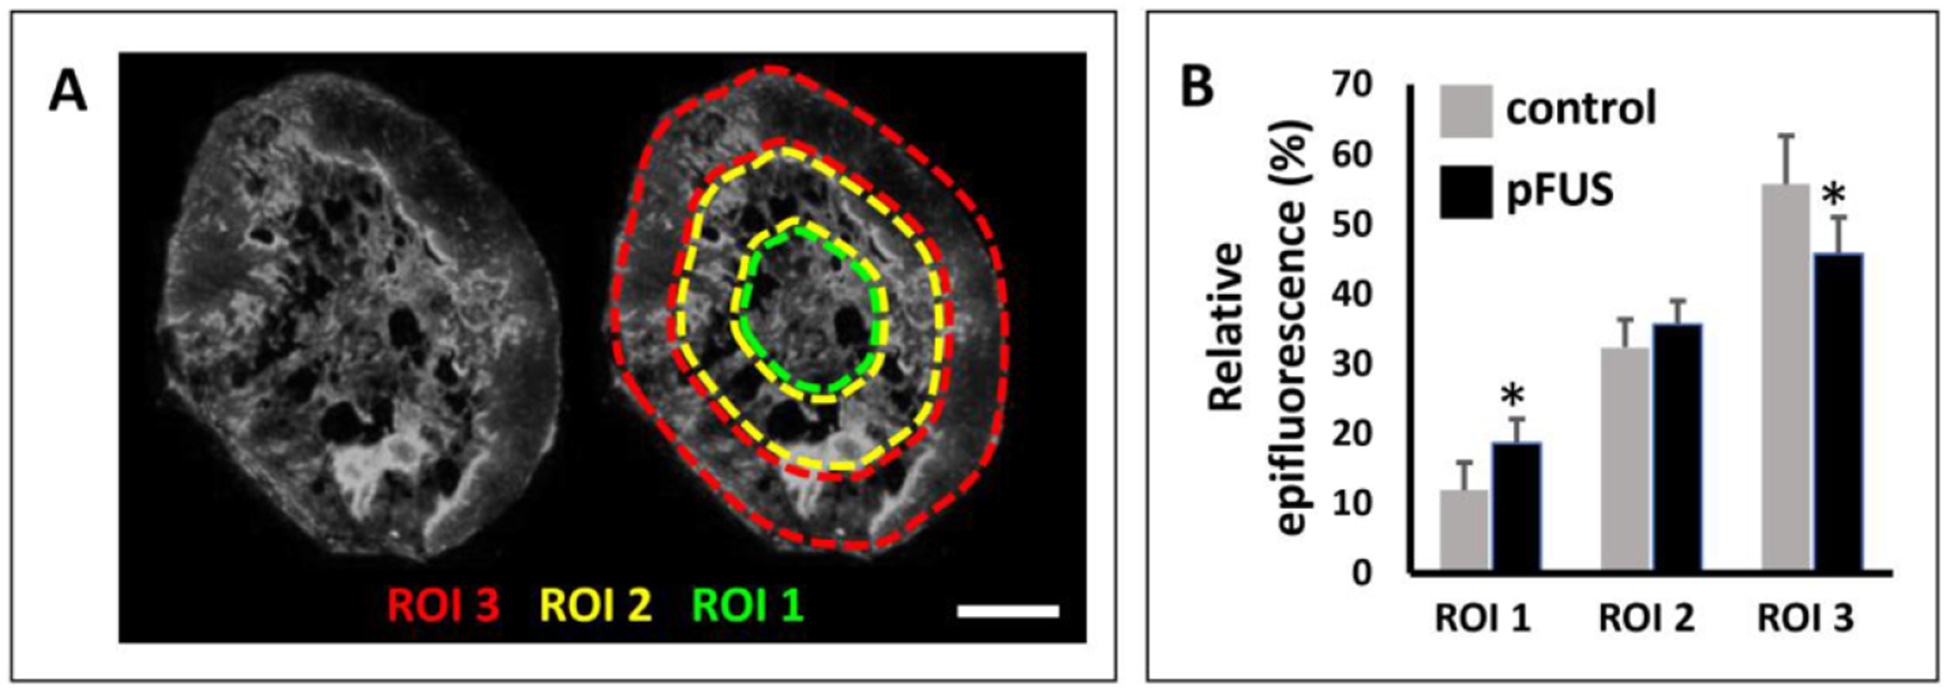
Figure 4.

Effects of pFUS pretreatment on NP penetration. (A) A representative tumor section indicating the three ROIs employed for quantifying the NP (200 nm) distributions (bar = 2 mm). (B) Comparison of relative NP distributions in the three ROIs for control and pFUS treated tumors (n = 7). An 18.1% decrease in NP delivery was found in the outermost region (ROI 3) in the pFUS treated tumors, compared to the control tumors. Conversely, in the innermost region (ROI 1), a 57% increase was found in the pFUS treated tumors compared to controls.
