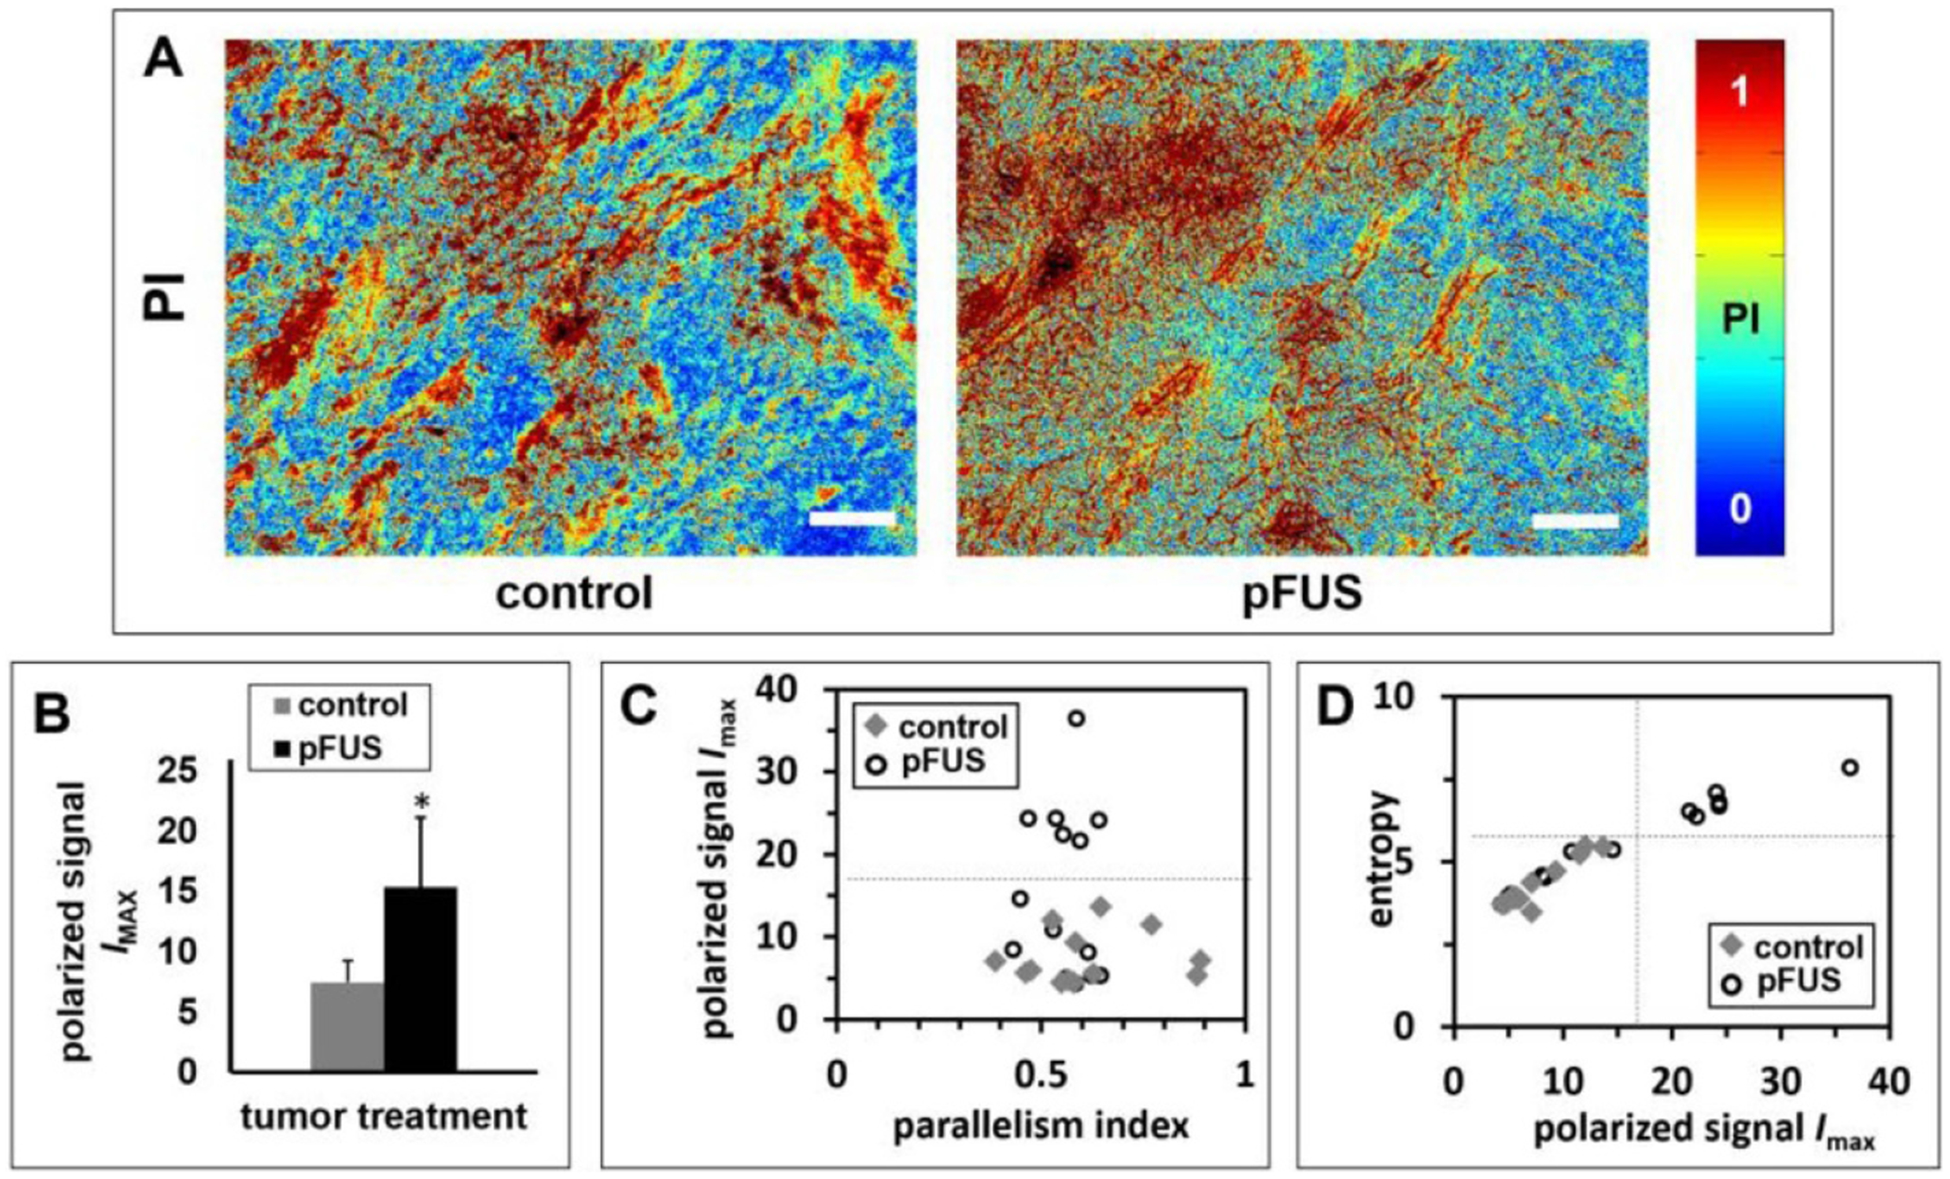
Figure 5.

Effects of pFUS treatment on the microstructure of the tumor fibrillar collagen network. (A) Representative PI maps of control and pFUS treated tumors, relating to the microstructure of birefringent material in the tumors (n = 3). Differences are observed in polarized maximum signal and texture of birefringence. (B) Average polarized maximum signal, IMAX, versus tumor treatment, indicating significantly greater values in pFUS treated tumors compared to controls. (C) Average polarized maximum signal, IMAX, versus PI. (D) Textural entropy versus IMAX. The correlation plots display variation among fields-of-view within and between groups, separated along two parameters from polarization signal maps. Separation of six fields-of-view from pFUS-treated tumors (with images from all tumors in the pFUS-treated group) was apparent from the correlation plots. Bars = 100 μm.
