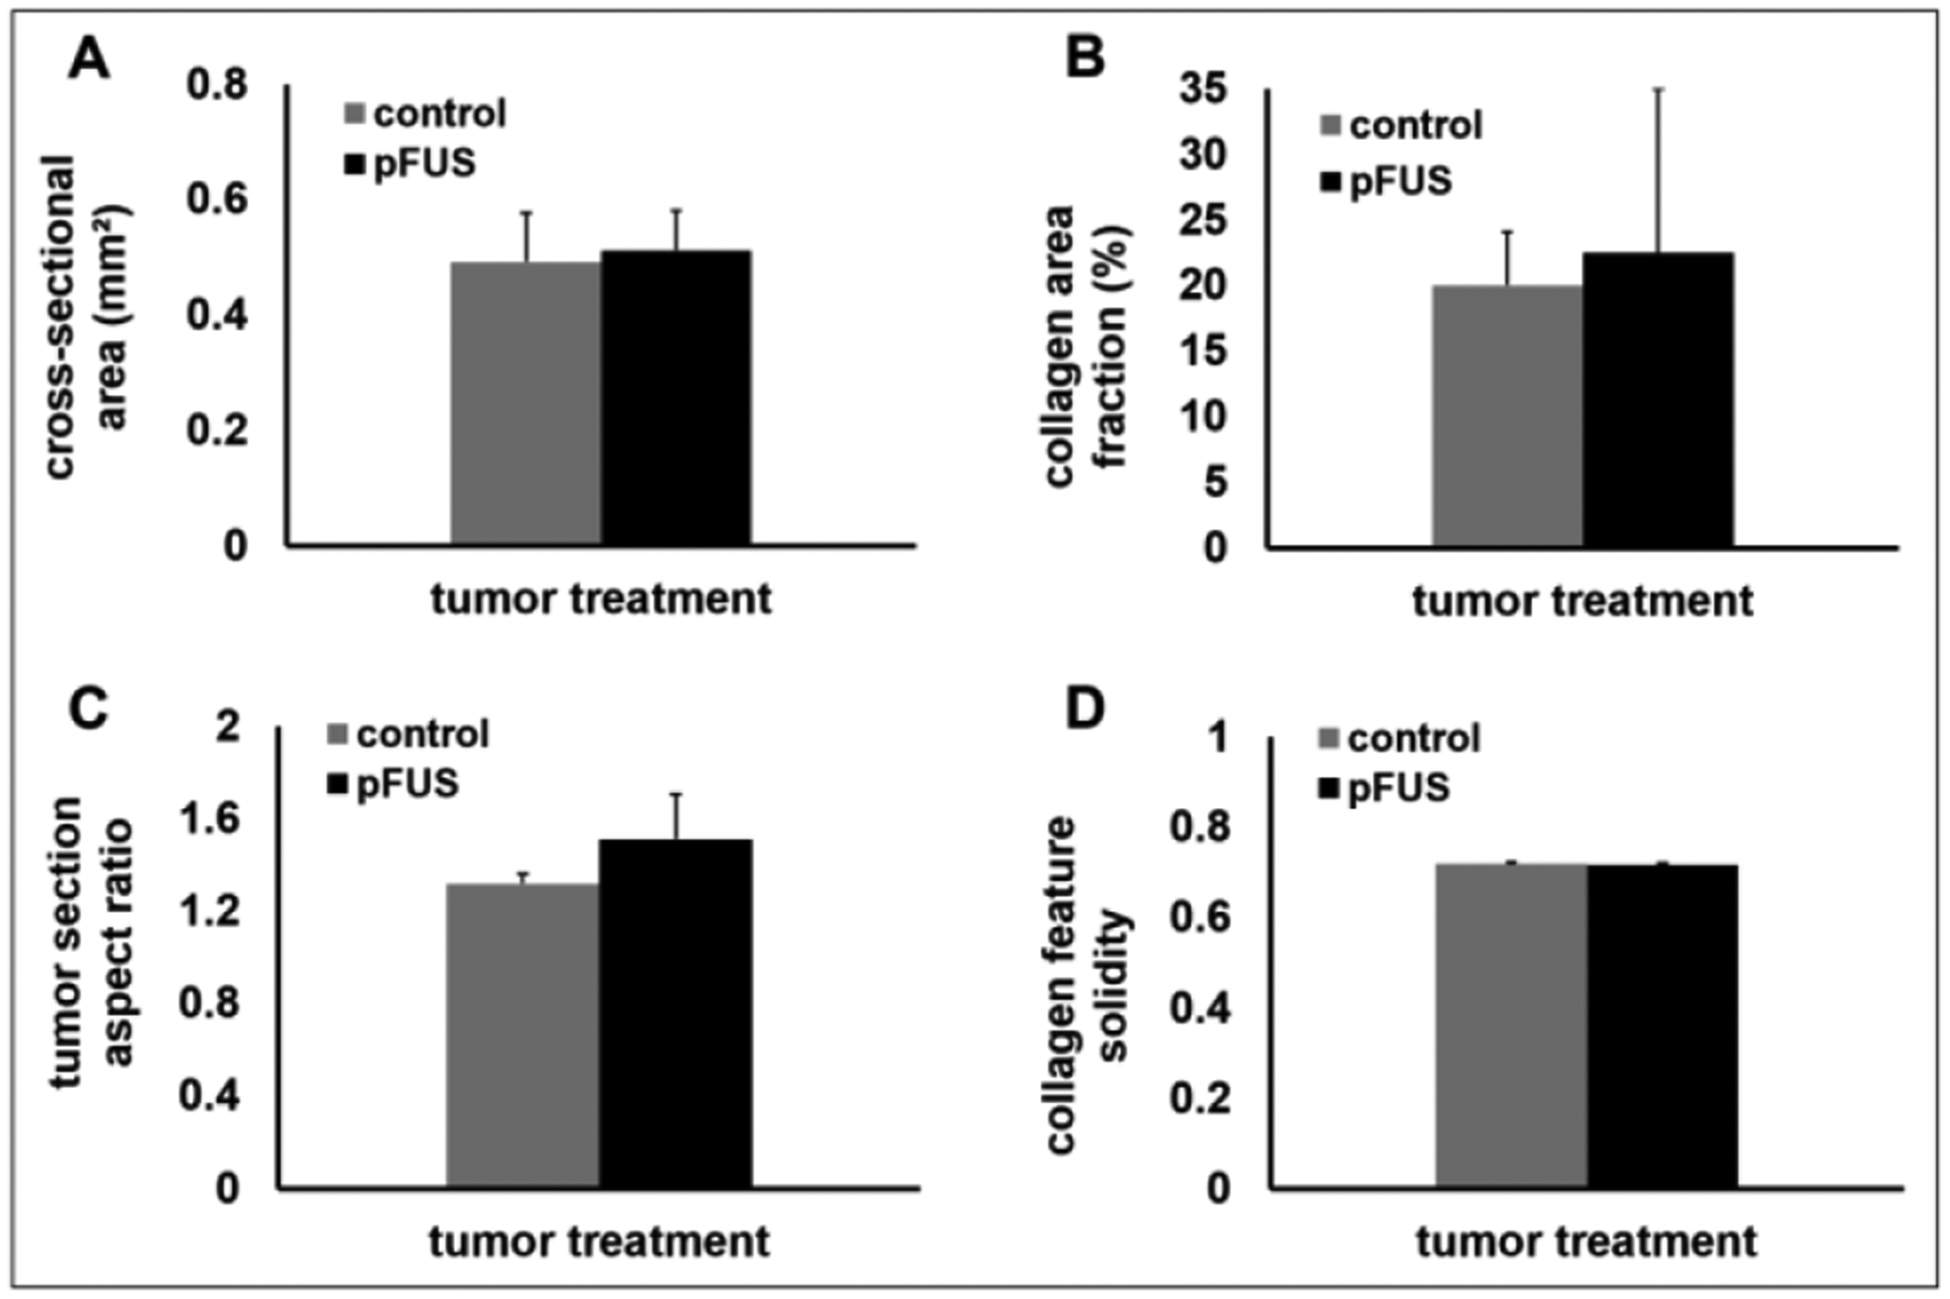
Figure 7.

Whole tumor section and histomorphometric comparisons. Control and pFUS-treated tumors were compared by (A) total slide cross-sectional area, (B) collagen area fraction within the tumor section, (C) tumor section aspect ratio, and (D) collagen feature solidity within the tumor section. Statistically significant differences were not detected in any of the metrics (n = 3 tumors per group; 3 sections per tumor).
