Figure 3.

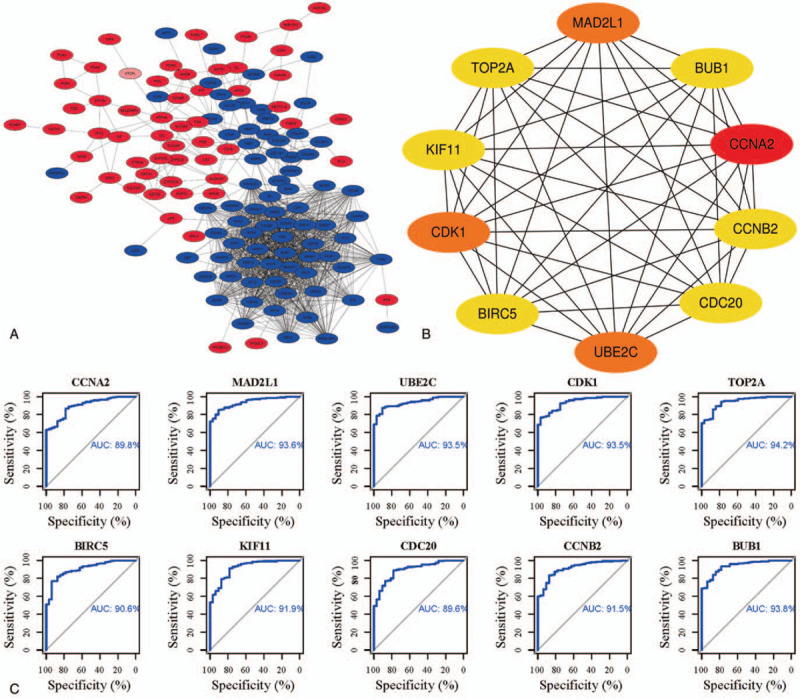
PPI network and top 10 hub genes. (a) PPI network, red denotes up-regulated, and the blue denotes down-regulated genes. (b) Top 10 hub genes. (c) The ROC curves of top 10 hub genes.

PPI network and top 10 hub genes. (a) PPI network, red denotes up-regulated, and the blue denotes down-regulated genes. (b) Top 10 hub genes. (c) The ROC curves of top 10 hub genes.