Figure 4.

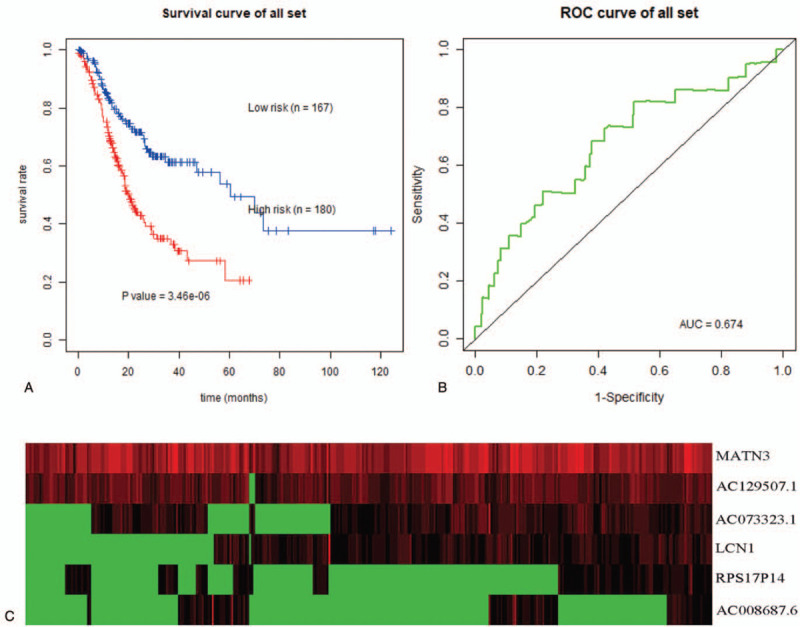
Survival prediction model of 6 genes for GEJAC. (a) Kaplan–Meier curve for high-risk and low-risk samples. (b) ROC curves for predicting 5-year OS in GEJAC. (c) Expression heat map of prognostic genes.

Survival prediction model of 6 genes for GEJAC. (a) Kaplan–Meier curve for high-risk and low-risk samples. (b) ROC curves for predicting 5-year OS in GEJAC. (c) Expression heat map of prognostic genes.