Figure 1.

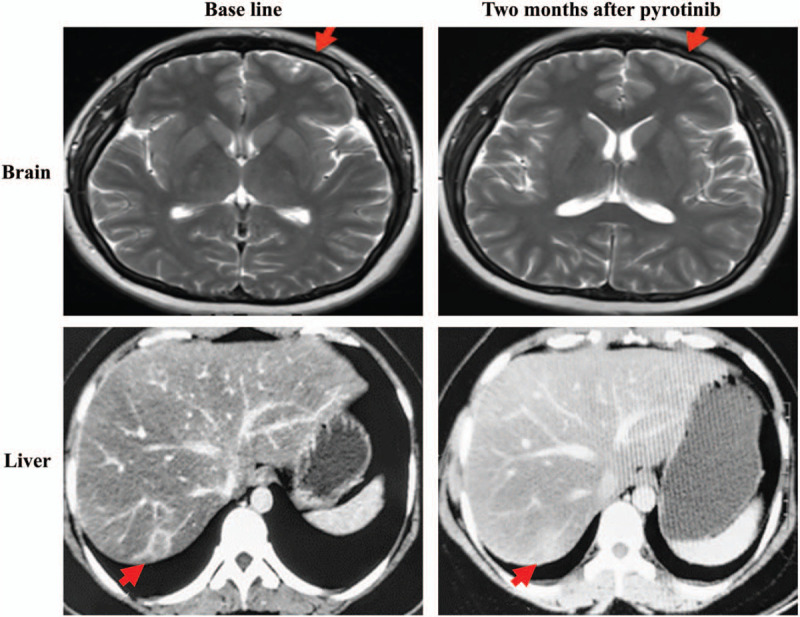
The magnetic resonance imaging of the brain and the computed tomography images (CT) of the liver before and after pyrotinib treatment. Red arrows represent the tumors.

The magnetic resonance imaging of the brain and the computed tomography images (CT) of the liver before and after pyrotinib treatment. Red arrows represent the tumors.