
Fig. 5.
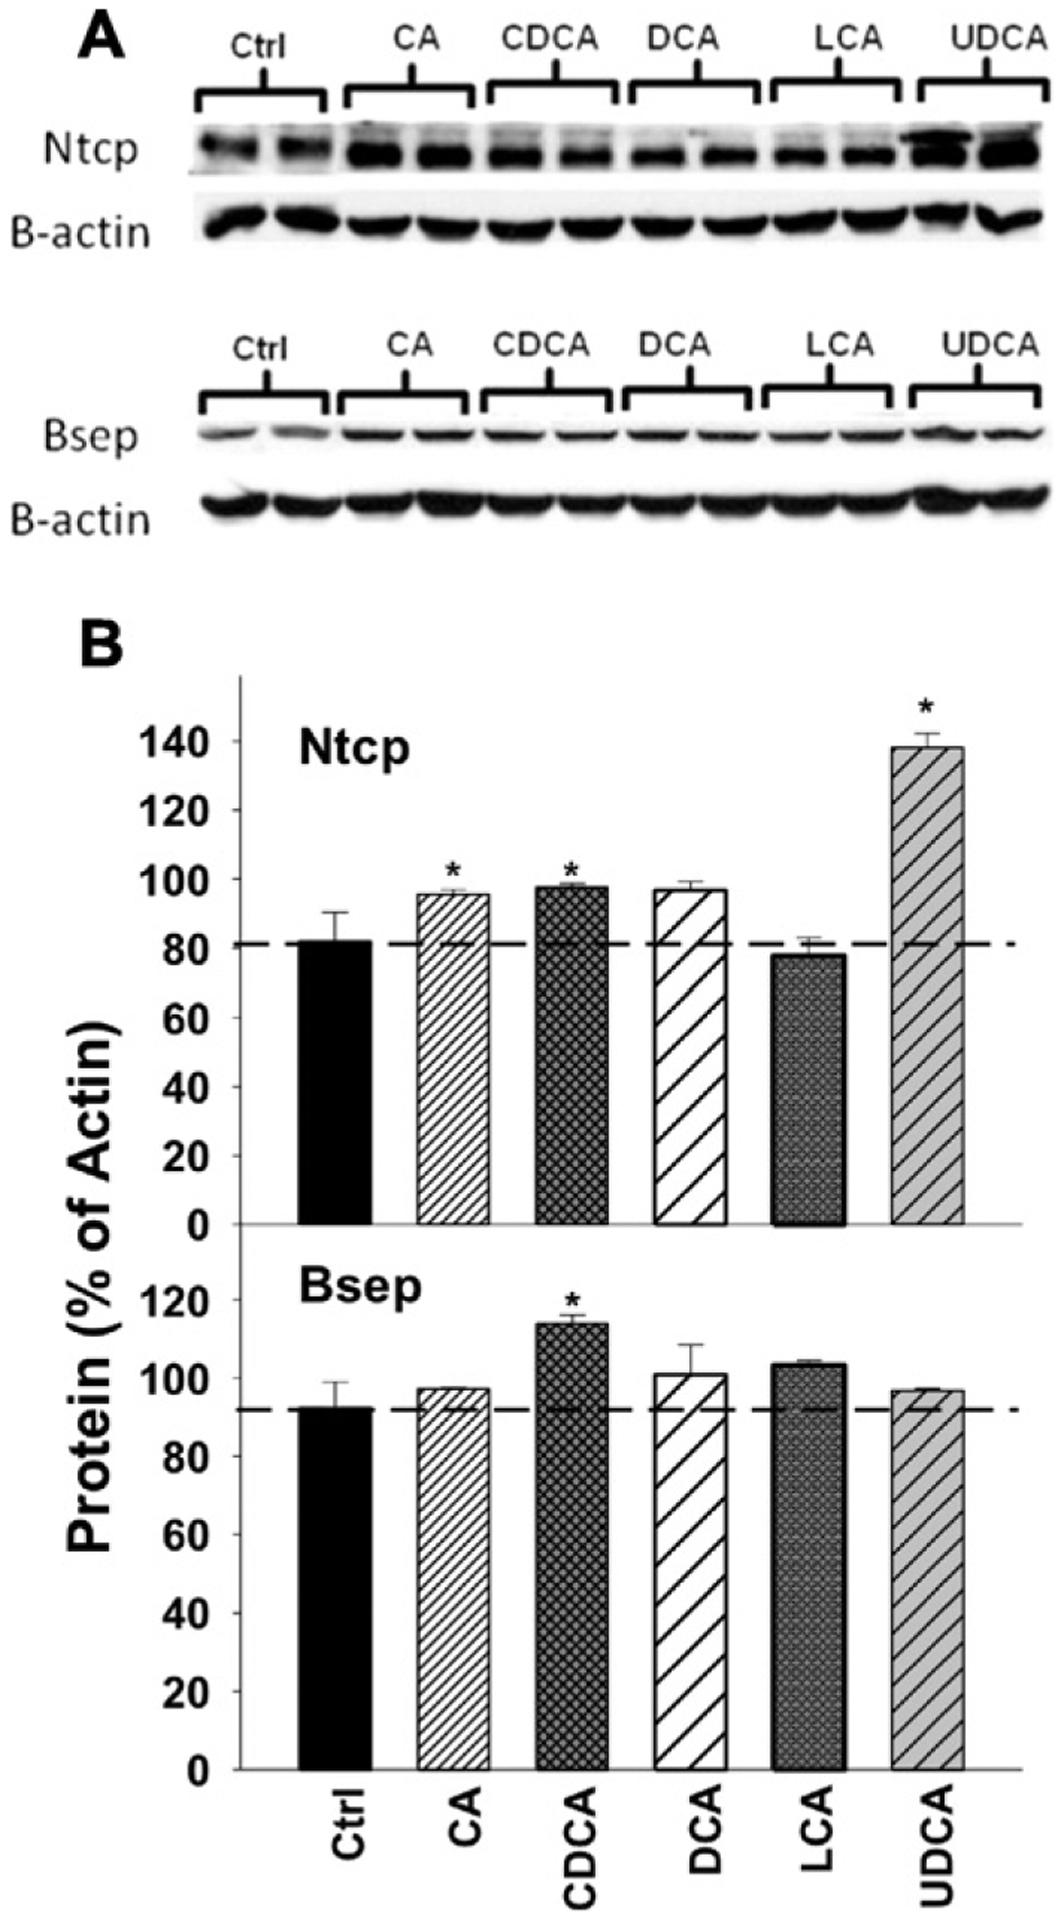
A: The proteins of Ntcp and Bsep were quantified by Western blotting analysis in control and mice fed with 0.1% BAs in diets (n = 2 mice per group per protein). The β-actin protein was used as a loading control. B: The protein densities on the blots were quantified for Ntcp and Bsep protein expression. Data are expressed as mean percentages of β-actin protein ± SE. Asterisks represent statistically significant changes compared to Control.