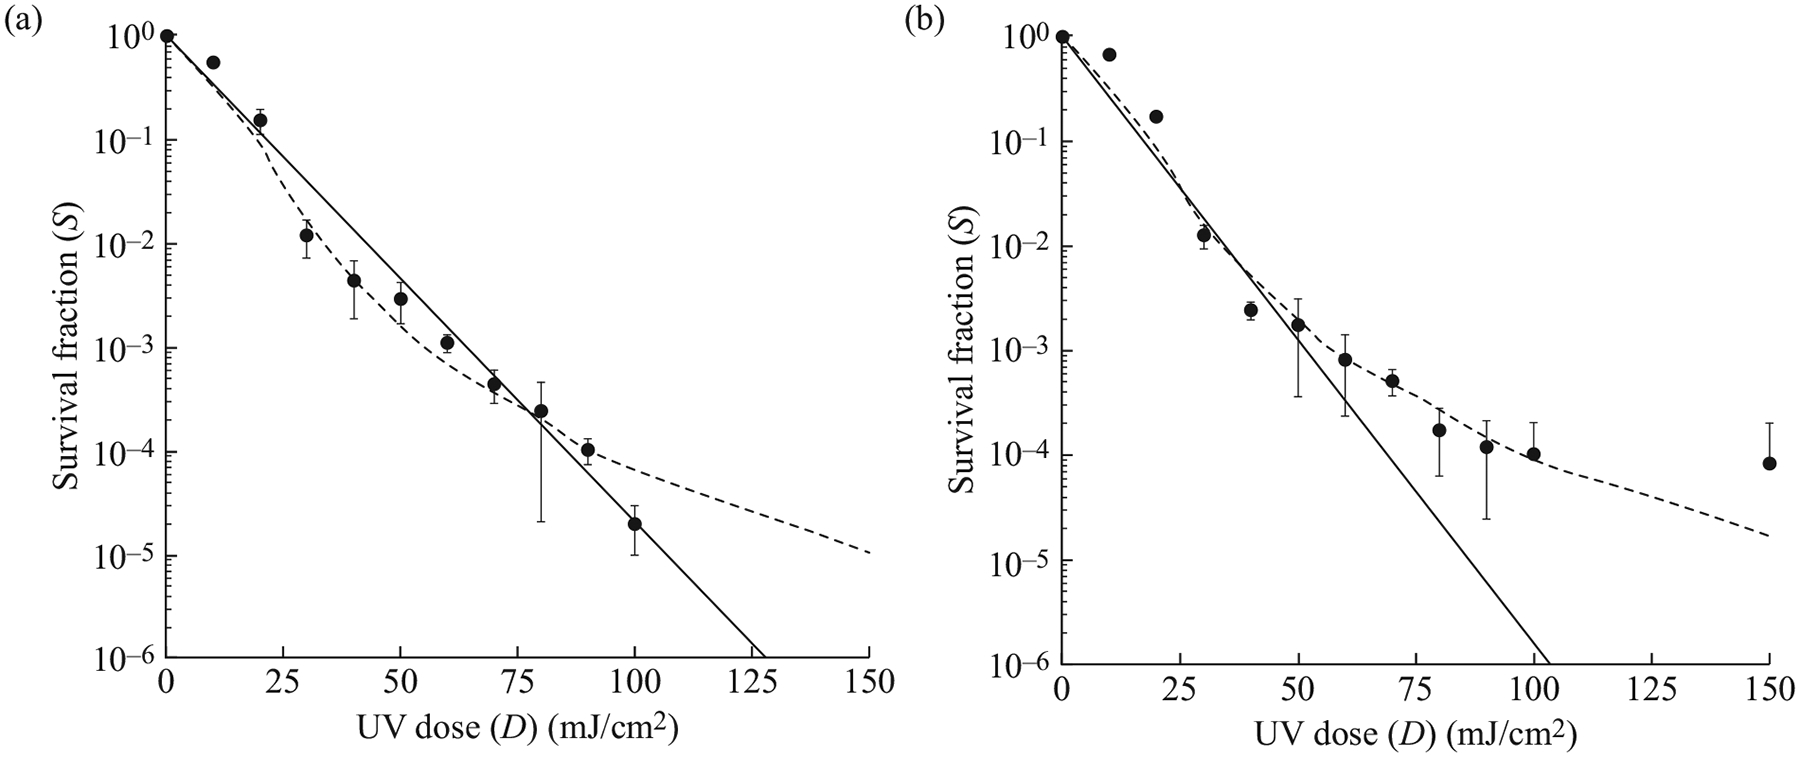
Figure 1.

Ultraviolet (UV) dose–response curves for two strains of Candida auris. The survival fraction at each UV dose tested (10–150 mJ/cm2) is represented by black dots for AR Bank #0382 (a) and AR Bank #0384 (b). The error bars represent the standard deviation observed following three independent experiments. The solid lines represent the best-fit line utilizing the exponential decay model. This model fit some strains well (e.g. AR Bank #0382) but underestimated the dose required above 3-log reductions in others (e.g. AR Bank #0384). A logistic regression model, represented by the dashed lines, was applied to the dose–response curves to better estimate the UV dose required for these higher log reductions.
