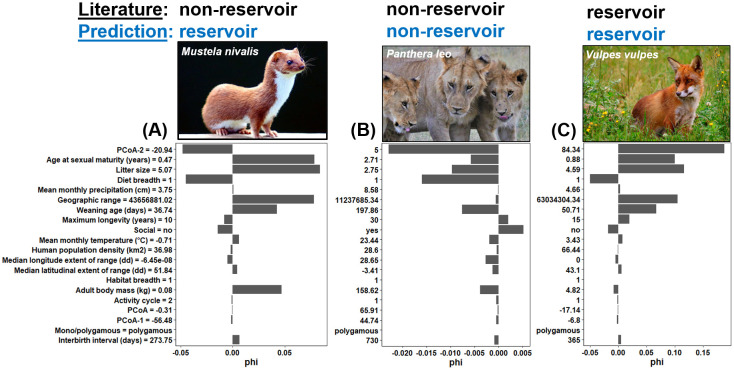
Fig 2. Illustrative examples of (A) a predicted reservoir: The least weasel (Mustela nivalis); (B) a non-reservoir: The lion (Panthera leo); and (C) a known reservoir: The red fox (Vulpes vulpes).
Bars denote trait importance based on the Shapley value (phi). Positive Shapley values indicate that predictors are increasing the likelihood that the outcome is positive (i.e., the likelihood a species is a reservoir for RABV), and negative Shapley values indicate that predictors are increasing the likelihood that the outcome is negative (i.e., the likelihood a species is not a reservoir for RABV). Values next to each trait represent the trait measure for each one of the three species (e.g., obtained from the PanTHERIA database). Least weasel and red fox photos were obtained from Wikimedia Commons (https://commons.wikimedia.org/) and the lion photo was the authors’ contribution. The text at the top of each image represents the reservoir status of each species based on the literature (black) and GBM models (blue).

