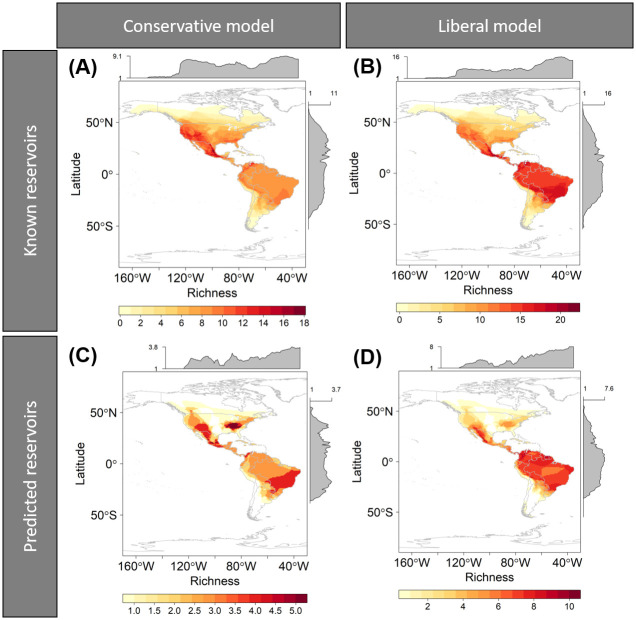
Fig 6. Geographic distribution of bat RABV reservoirs identified by the conservative model ((A) and (C)) and the liberal model ((B) and (D)).
Panel (A) and (B) represent known reservoirs, and panel (C) and (D) predicted reservoirs. The maps show areas with high (red), moderate (orange), and low (yellow) number of bat RABV reservoirs. Grey histograms represent the richness level (i.e., the number of reservoir species in each pixel).

