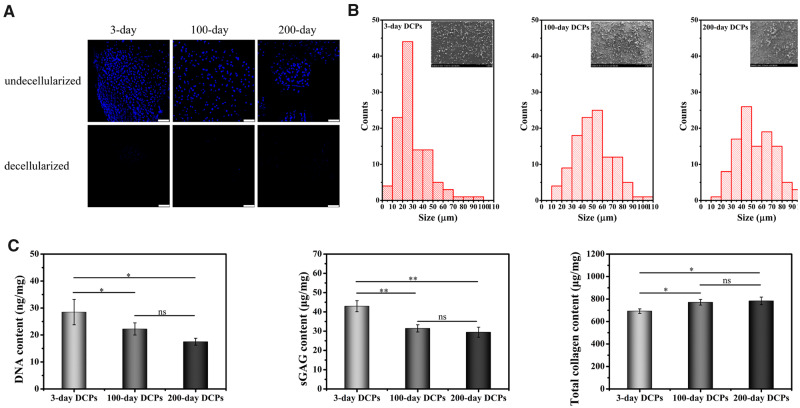
Figure 2.
Characterization of DCPs from newborn, juvenile or adult rabbits. (A) DAPI staining before and after decellularization. Scale bars represent 100 μm. (B) Size distributions of the DCPs. (C) The quantification of DNA, sGAG and total collagen in the DCPs (n = 3). ns indicates P > 0.05,* indicates P < 0.05, ** indicates P < 0.01 and *** indicates P < 0.001.

