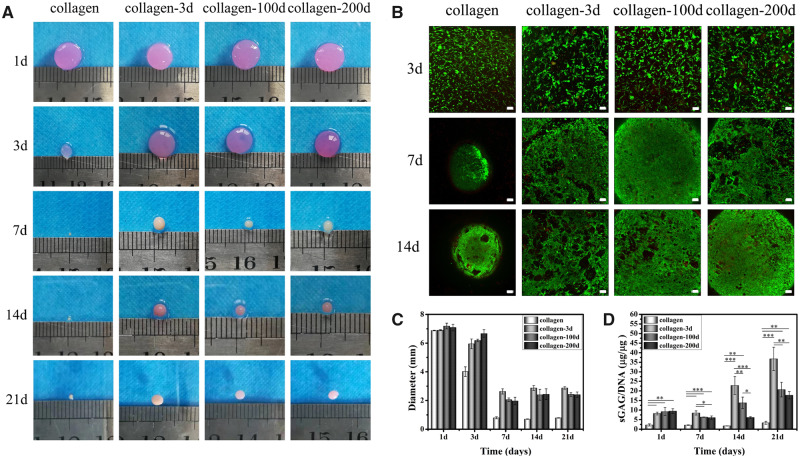
Figure 4.
(A) Gross appearance of four BMSCs/hydrogel constructs. (B) FDA/PI image of four hydrogels from Days 3 to 14. Scale bars represent 100 μm. (C) The diameter change and (D) quantitative analysis of sGAG/DNA in each sample at different time points. Data are presented as the mean ± SD (n = 3). ns indicates P > 0.05, * indicates P < 0.05, ** indicates P < 0.01 and *** indicates P < 0.001.

