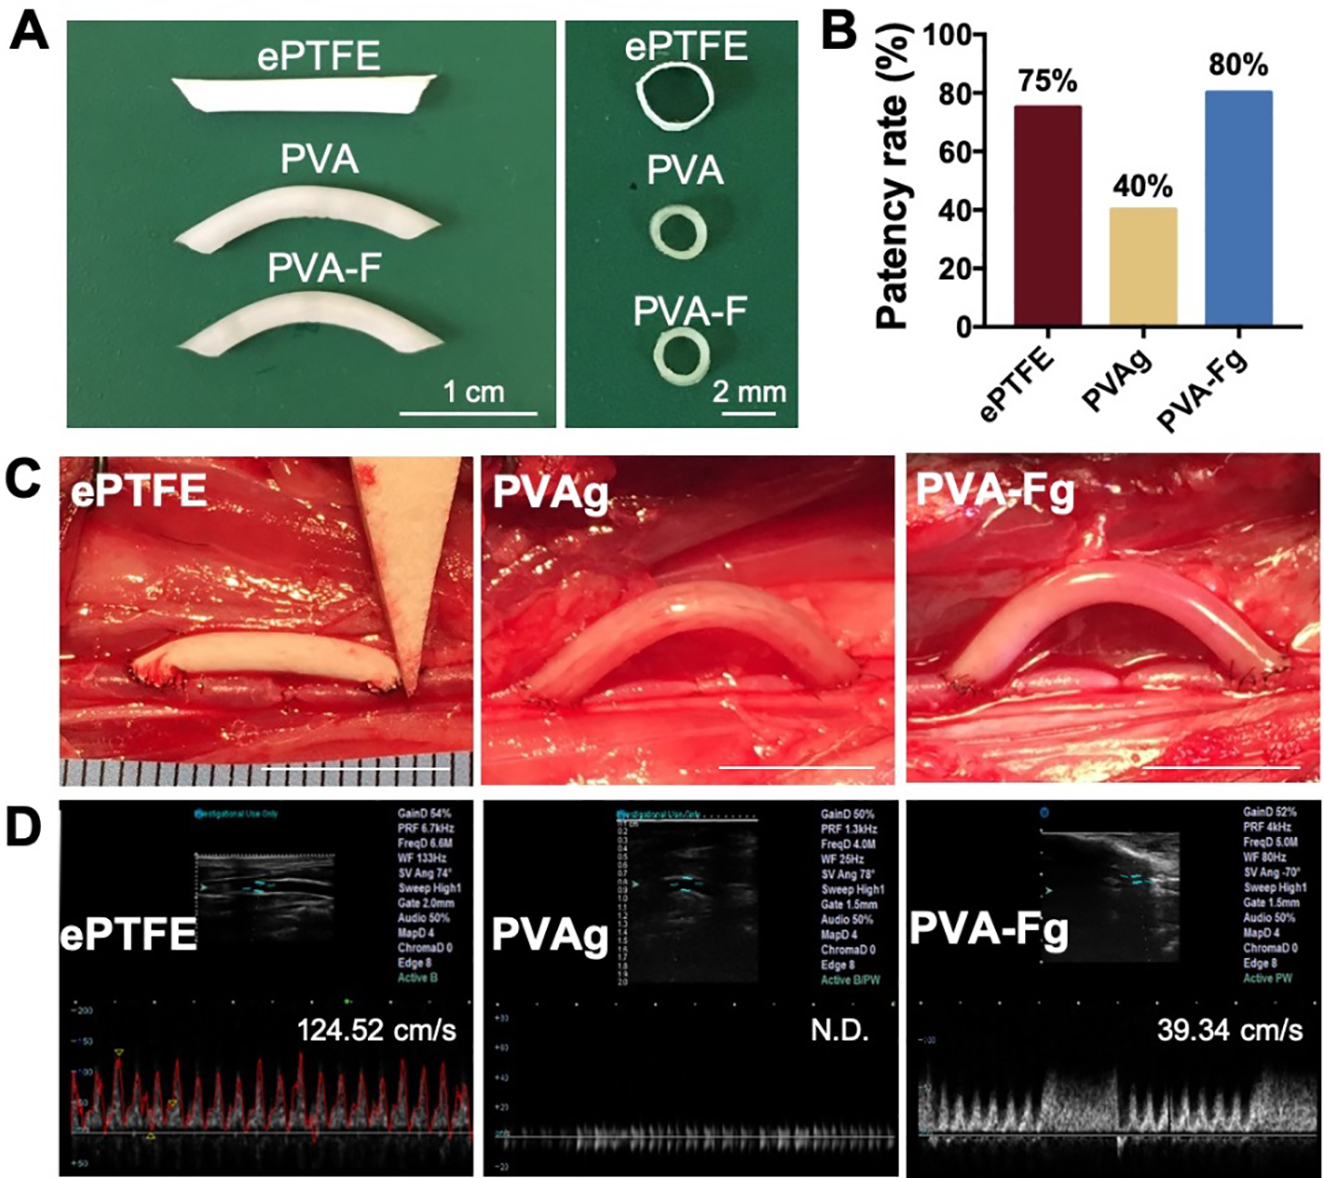
Figure 7.

Implantation of ePTFE, PVAg, and PVA-Fg grafts. (A) Dimensions of implanted grafts. (B) Patency rate of ePTFE (n=4), PVAg (N=5), and PVA-Fg (n=5). (C) Representative images of ePTFE graft, PVAg graft, and PVA-Fg graft after implantation. Scale bar=1cm. (D) Representative ultrasound images of ePTFE, PVAg, and PVA-Fg grafts and flow velocity (peak systolic velocity) inside the grafts after 1-month implantation. (N.D. not determined)
