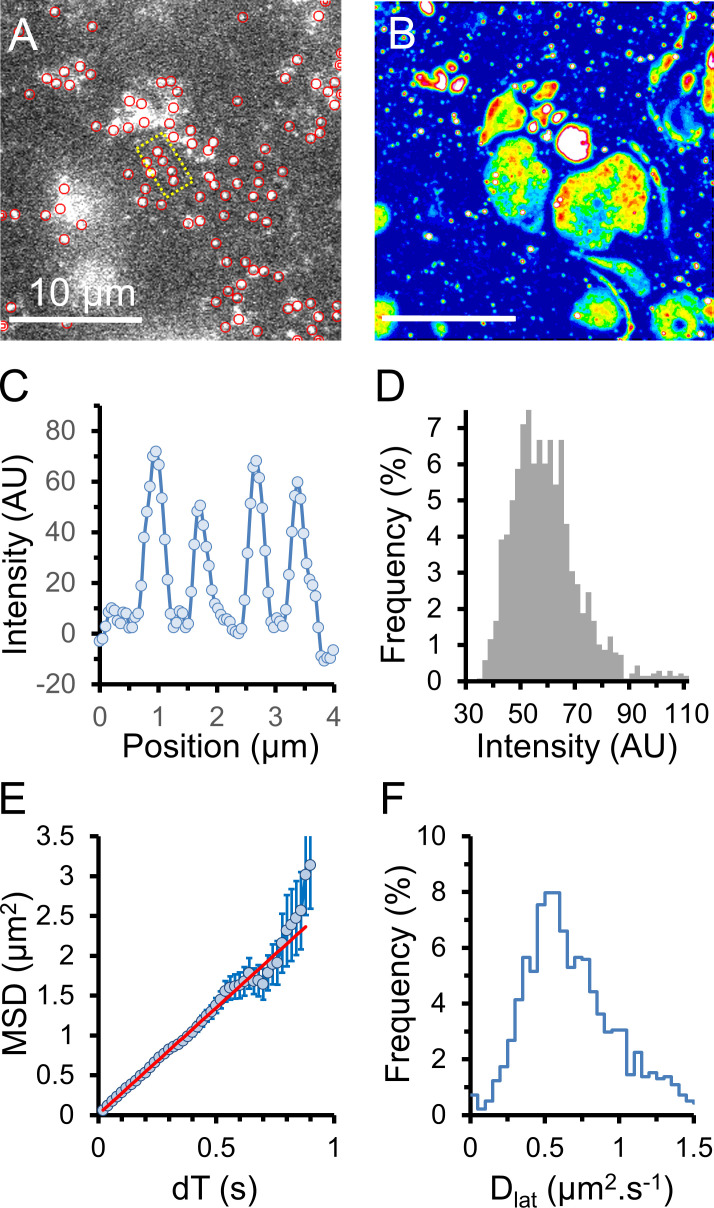
Figure 4.
Cy3B-telenzepine–labeled M2 muscarinic receptors on the plasma membrane of cardiomyocytes in an adult zebrafish heart slice. (A) Single image from the beginning of the record shows individual receptors on the surface of the exposed cardiomyocytes. Note the difference in the M2 density between neighboring myocytes. (B) Normalized SD z-projection image created from the video record (∼500 frames) of the slice shown in A. The cell footprints are now clearly visible. (C) Line profile of image intensity within the yellow boxed area in A. Individual fluorescent spots have similar intensity (50–70 counts/pixel, above background, measured over a 5 × 5 pixel region). (D) Histogram showing the intensity distribution of fluorescent spots identified in the video recording (1,379 spots). Data are consistent with the M2 receptors being overwhelmingly monomeric. (E) MSD versus dT plot is fitted to a straight line (red) by least squares linear regression where the gradient = 4Dlat, giving an estimated Dlat = 0.67 µm2 ⋅ s−1; error bars show SEM at each dT interval. (F) Histogram showing the distribution of Dlat estimates measured for every tracked object (n = 1,379); median Dlat = 0.7 µm2 ⋅ s−1. AU, arbitrary units.

