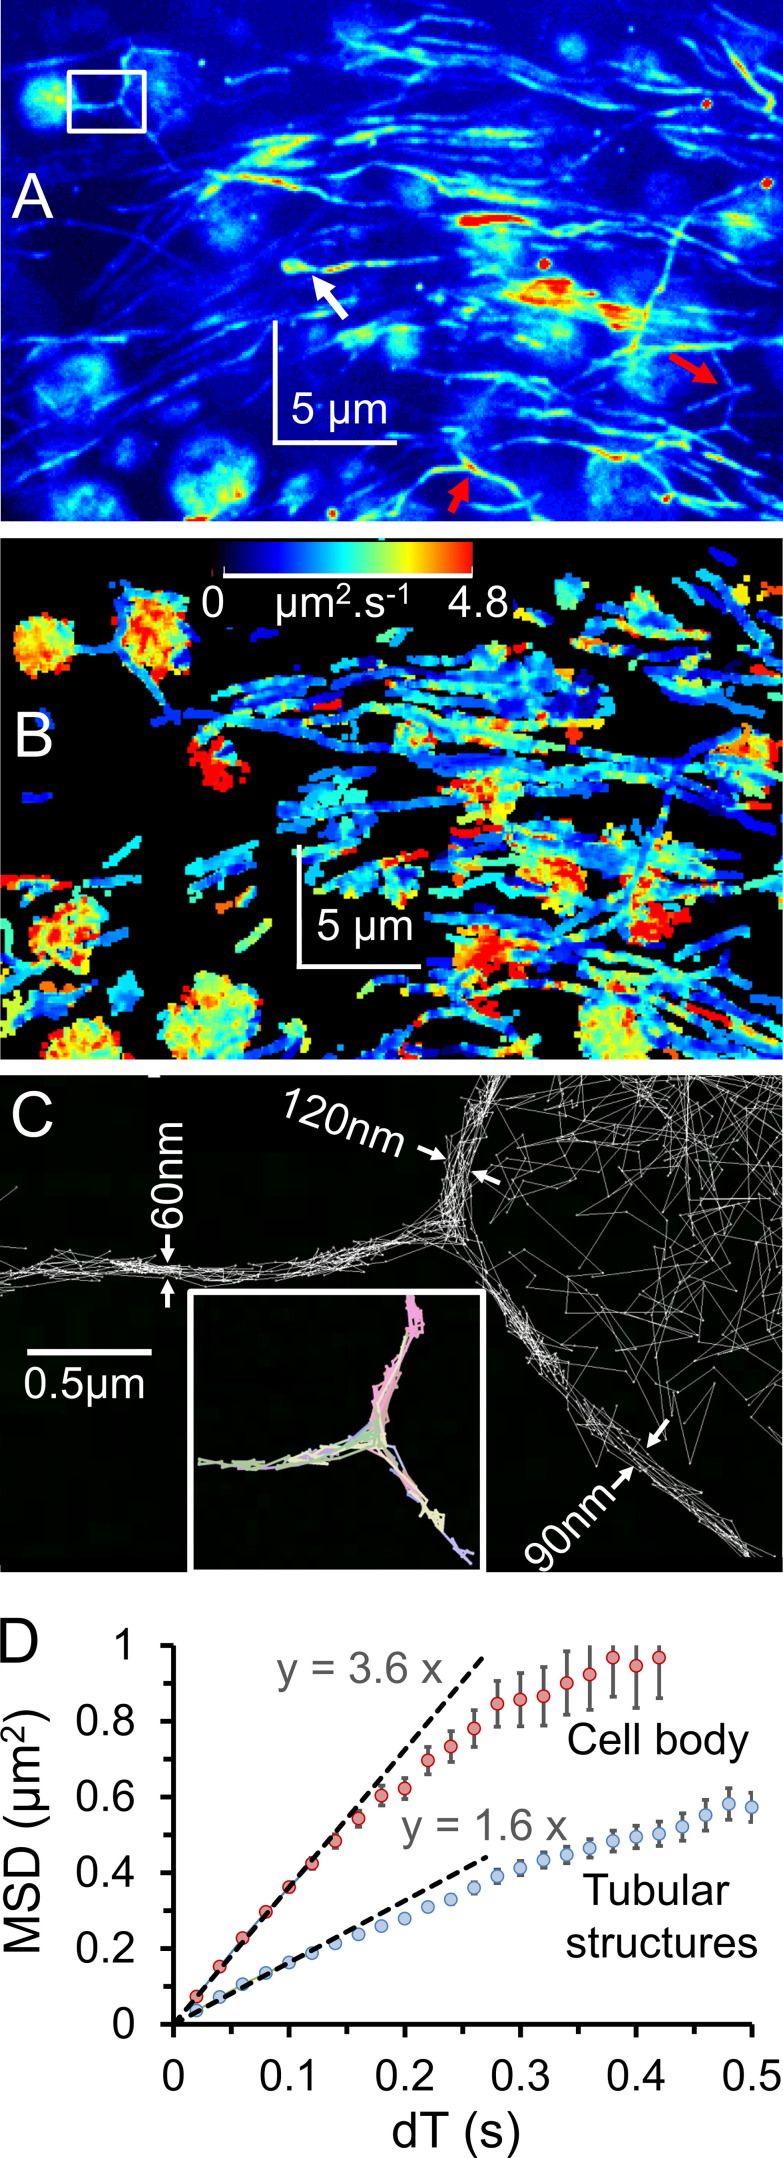
Figure 5.
Cy3B-telenzepine in vivo–labeled mouse heart slice. (A) Normalized SD z-projection (shown using an arbitrary pseudo-color lookup table for display purposes) shows the distribution of rapidly moving M2 receptors on myocytes and nerve fibers. Nerve fiber “Y”-branches are marked by red arrows, and the white rectangle marks are the position of trajectories shown in C. (B) Color-coded average mobility map calculated using all single-molecule trajectories. The lookup table palette (top center) refers to the gradient of MSD versus dT plots ranging from 0 to 4.8 µm2 ⋅ s−1. Receptor mobility on nerve fibers (predominantly blue) appears slower than on cardiomyocytes. (C) Zoomed region from A shows individual molecular trajectories that delineate nerve ultrastructure with super-resolution. The lower insert shows selected colored trajectories of individual molecules that move in all three directions at the Y-branch point. (D) MSD versus dT plot indicates that receptor mobility is higher in the myocyte cell body than in the tubular neuronal structures (3.2 µm2 ⋅ s−1 and 1.6 µm2 ⋅ s−1 resp.; see Discussion for explanation).

