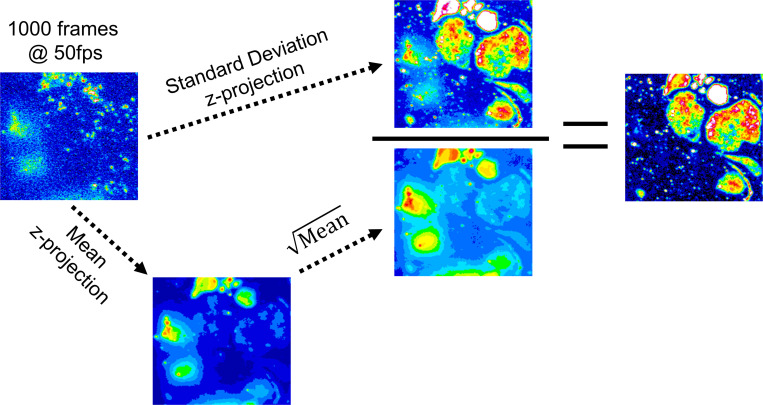
Figure S1.
Construction of the normalized SD z-projection maps. The original video record is represented by the first frame in the image stack (top left). The image stack is z-projected as a single frame of the same pixel dimensions corresponding to the SD in pixel intensity (the “numerator,” top center) or the mean of pixel values (bottom left). The intensity variations are due to shot-noise scale with the square-root of mean intensity (the “denominator,” bottom center). The resulting projection is the “normalized” SD (right). Note that bright but diffuse regions on the left side of the original image disappear, whereas regions where fluorescent molecules move rapidly at the cell membrane (top right regions of the image) have large fluctuations in pixel intensity that are greatly enhanced in the normalized SD z-projection.

