Figure 4.
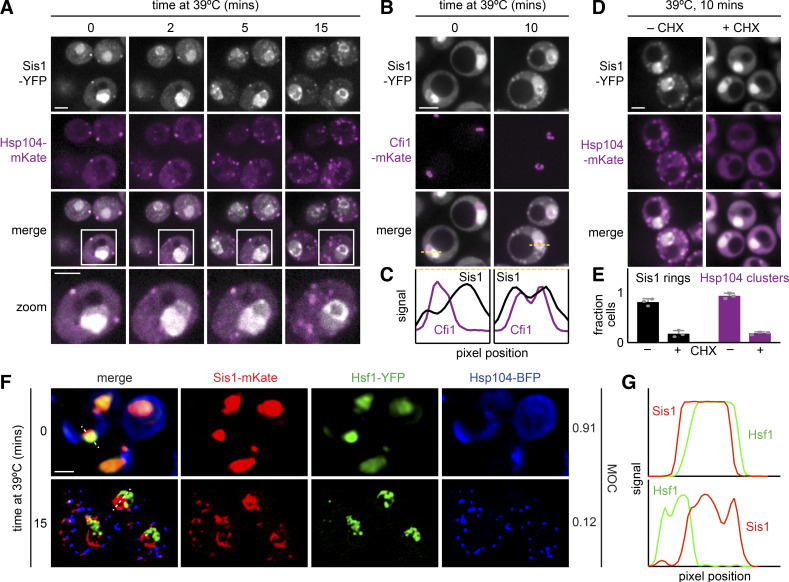
Sis1 localizes to a perinucleolar ring and cytosolic clusters during heat shock. (A) Live-cell heat shock time course of cells expressing endogenously tagged Sis1-YFP and Hsp104-mKate. Cells were imaged by spinning disc confocal microscopy. Scale bar is 2 µm. (B) Cells expressing endogenously tagged Sis1-YFP and the nucleolar marker Cfi1-mKate imaged under nonstress and heat shock conditions. Scale bar is 2 µm. (C) Scans of fluorescence signal for Sis1-YFP (black) and Cfi1-mKate (purple) along the dashed lines in the merged images in B. (D) Cells expressing endogenously tagged Sis1-YFP and Hsp104-mKate following 10 min of heat shock after either no pretreatment or pretreatment with cycloheximide (CHX) to arrest protein synthesis. Scale bar is 2 µm. (E) Quantification of the fraction of cells with an Sis1 nuclear ring (black) and Hsp104 clusters (purple) after either no pretreatment or pretreatment with CHX. Experiments were performed with >50 cells in each replicate. Error bars represent the SD of the replicates (n = 3 for each strain and condition). (F) Live cells expressing endogenously tagged Sis1-mKate, Hsf1-YFP, and Hsp104-BFP were imaged in a lattice light-sheet microscope under nonstress conditions and following heat shock at 39°C for 15 min. MOC is a fraction of Sis1 that colocalizes with Hsf1. Scale bar is 2 µm. (G) Scans of fluorescence signal for Sis1-mKate (red) and Hsf1-YFP (green) along the dashed lines in the merged images in F.

