Figure S3.
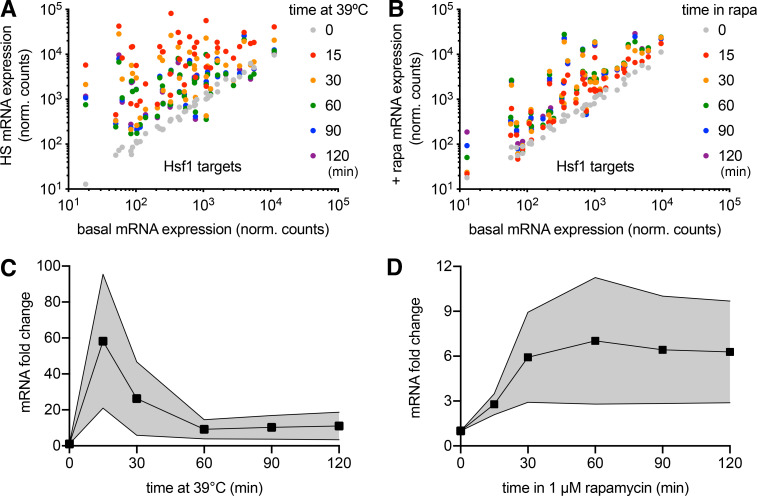
Comparative transcriptomics following heat shock and Sis1 AA. (A) All 42 Hsf1 target gene expression levels over a heat shock (HS) time course. Most genes peak at the 15-min time point. (B) All 42 Hsf1 target gene expression levels for a time course following Sis1 AA. Levels do not decline over time and peak at later time points for most genes. (C) The average (line and points) and SD (shaded area) of the induction of the 42 Hsf1 target genes over a heat shock time course showing the adaptive response. (D) The same as in E, but for the Sis1 AA time course. There is no adaptation, suggesting the feedback loop has been severed. ns, not significant; rapa, rapamycin.

