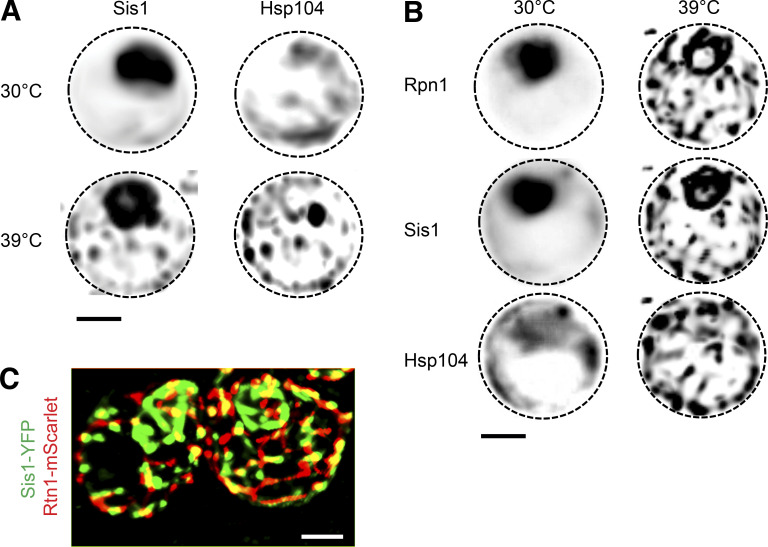
Figure S5.
The proteostasis machinery forms a contiguous network on the ER. (A) Maximum-intensity negative projections of Sis1-YFP and Hsp104-BFP signal in cells under nonstress and heat shock conditions (39°C for 15 min). The signal is enhanced to show the cytosolic interconnections between the nodes. Scale bar is 2 µm. (B) The same as in A, but for the proteasome component Rpn1. (C) Overlay of Sis1-YFP and Rtn1-mScarlet from Fig. 5 C. Scale bar is 2 µm.

