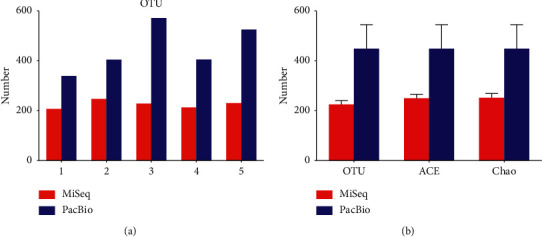
Figure 3.

Richness of oral saliva. (a) OTU distribution of the 5 samples sequenced by MiSeq and PacBio platforms. (b) Comparison of OTU number and richness indices (Chao and ACE) between PacBio and MiSeq platforms. Different colors indicate different platforms.
