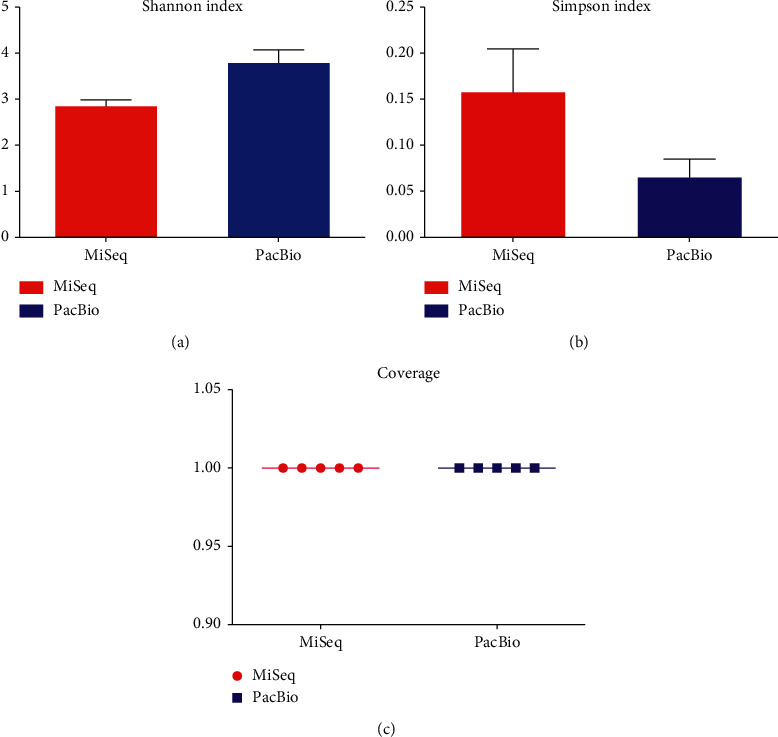
Figure 4.

Comparison of α-diversity and coverage between MiSeq and PacBio platforms. (a) Shannon index, which can reflect how many OTUs there are in saliva and simultaneously take into account how evenly the OTUs are distributed among the oral microbiome. (b) Simpson index, which is used to measure the degree of concentration when oral microbiota are classified into OTUs. (c) Coverage, which is calculated from the length of the original genome (G), the number of reads (N), and the average read length (L) as N∗L/G.
