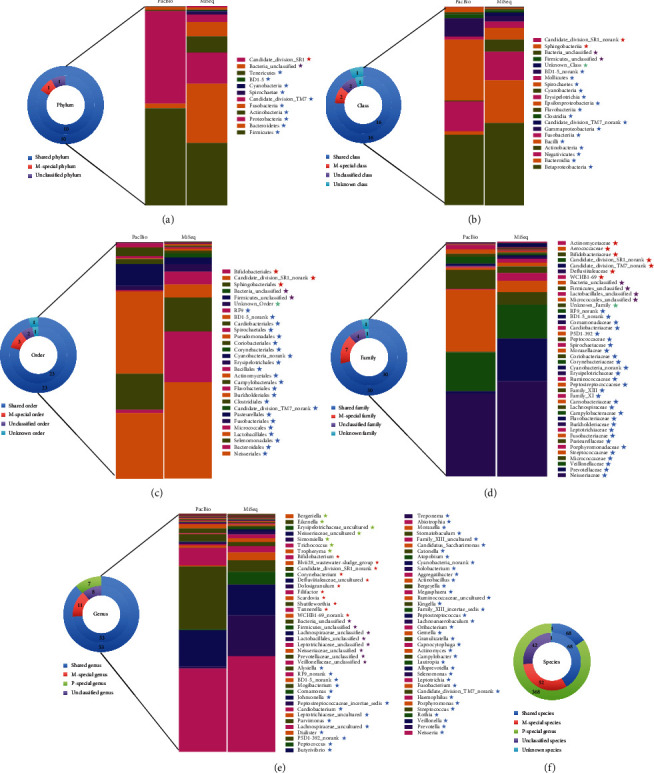
Figure 6.

Community structures sequenced by PacBio and MiSeq platforms.  represents the number of organisms shared by the two platforms and the detail taxonomy information was shown on the right bar chart. The star of the same color represents the names of the shared organism.
  represents the number of organisms generated only by MiSeq platforms and the detail taxonomy information was shown on the right bar chart. The star of the same color represents the names of the organism only generated by MiSeq.
  represents the number of unclassified organism and the detail taxonomy information was shown on the right bar chart. The star of the same color represents the names of the unclassified organism.
  represents the number of unknown organism and the detail taxonomy information was shown on the right bar chart. The star of the same color represents the names of the unknown organism.
  represents the number of organisms generated only by PacBio platforms and the detail taxonomy information was shown on the right bar chart. The star of the same color represents the names of the organism only generated by PacBio. (a–f) represents phylum, class, order, family, genus and species level, respectively.
