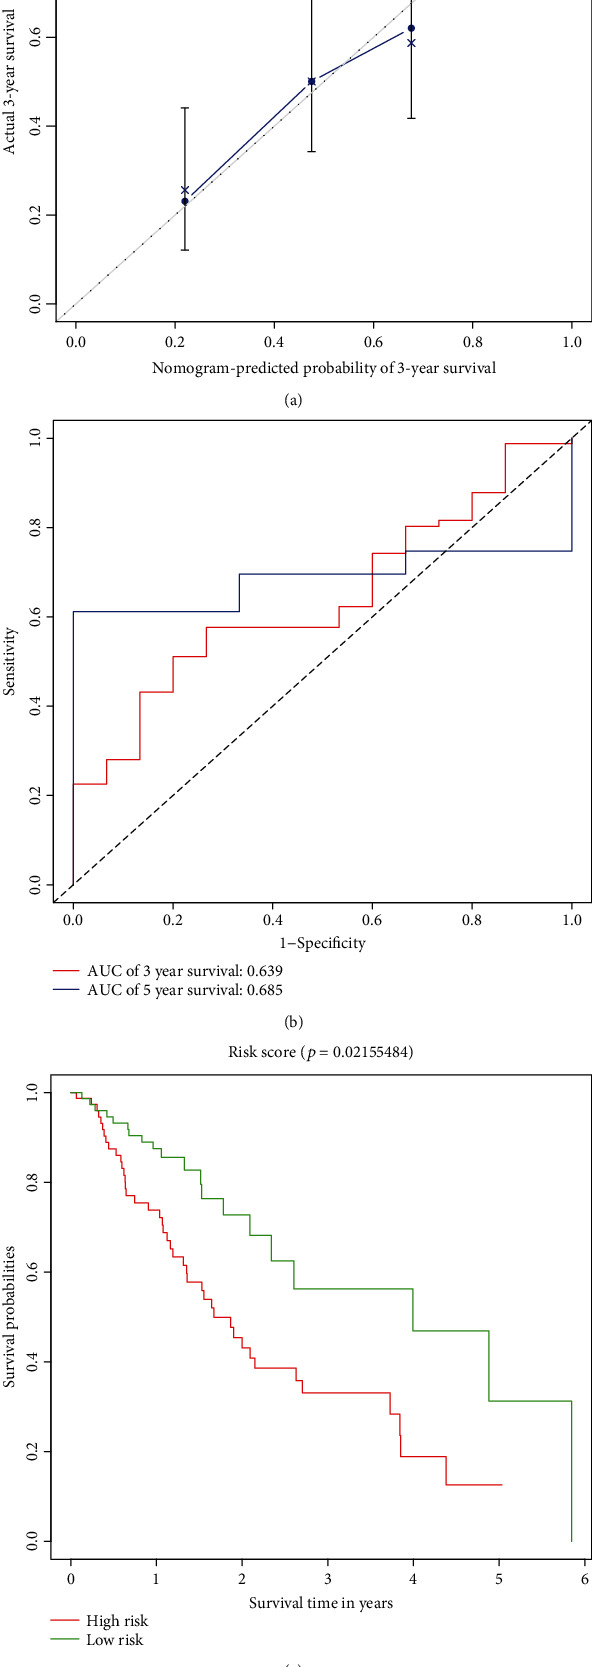
Figure 9.

Evaluation of model prognostic ability. (a) The calibration curves of the 3-year overall survival rate; the abscissa was the predicted mortality of the model, and the ordinate was the actual mortality. (b) The receiver operating characteristic (ROC) curve of the three-year survival rate and the five-year survival rate predicted by the model. (c) Kaplan-Meier plots of overall survival for patients with a high- or low-risk score of the EC patients.
