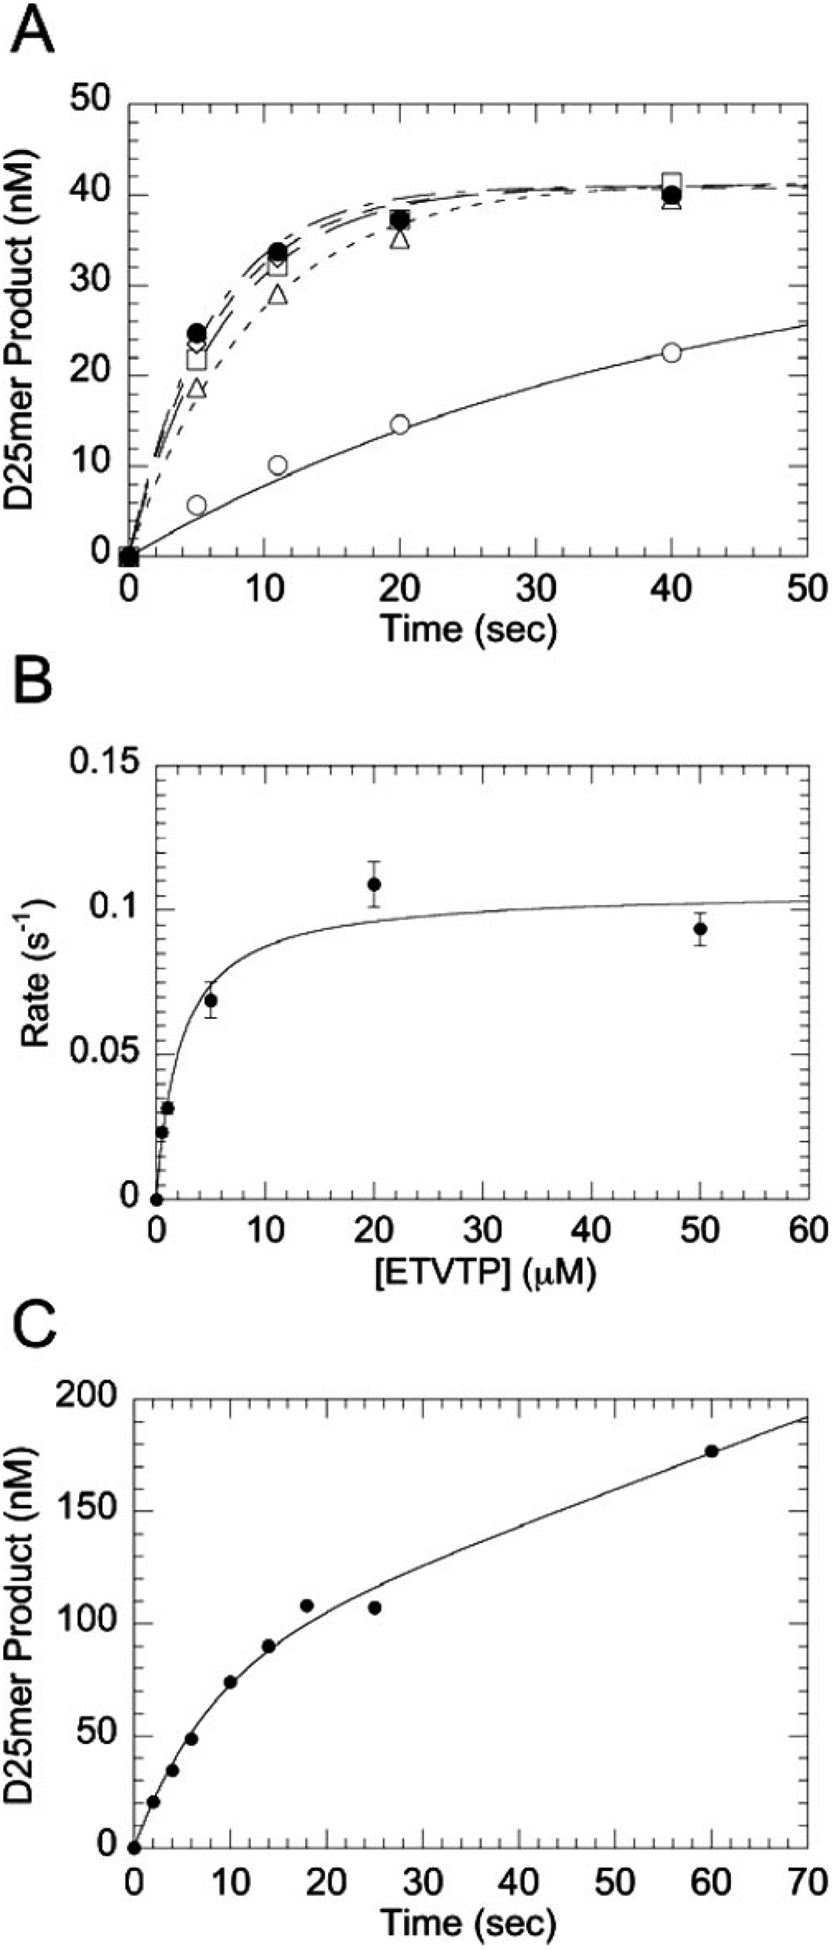
FIGURE 2. Concentration dependence of the observed rate on ETVTP concentration for WT HIV-1 RT.

A, single-turnover incorporation was measured by mixing a preincubated solution of RT (250 nm) and DNA/DNA primer/template (50 nm) with various concentrations of ETVTP (curves displayed represent 0.5 μm (○), 1 μm (□), 5 μm (◇), 20 μm (●) and 50 μm (△)) and MgCl2 (10 mm) at 37 °C (all concentrations are final after mixing). B, Kd,ETVTP curve was generated from all ETVTP concentrations tested (500 nm to 50 μm) where the observed rate (kobsd) was plotted against ETVTP concentration. The fit to the data gives an equilibrium binding constant (Kd,ETVTP) of 2.23 ± 0.67 μm and a maximum rate of incorporation (kpol) of 0.107 ± 0.007 s−1. C, pre-steady-state burst kinetics of incorporation of ETVMP into a DNA/DNA primer/template by WT RT were measured by mixing a preincubated solution of RT (100 nm) and primer/template (300 nm) with ETVTP (50 μm) and Mg2+ (10 mm) under rapid quench conditions (all concentrations are final after mixing). The reaction was quenched at indicated times and analyzed by 20% sequencing gel electrophoresis. The solid line represents a fit to a burst equation with an amplitude (A) equal to 79 ± 12 nm, an observed first-order rate constant for the burst phase (kobsd) equal to 0.125 ± 0.031 s−1, and an observed rate for the linear phase (kss) equal to 0.020 ± 0.006 s−1.
