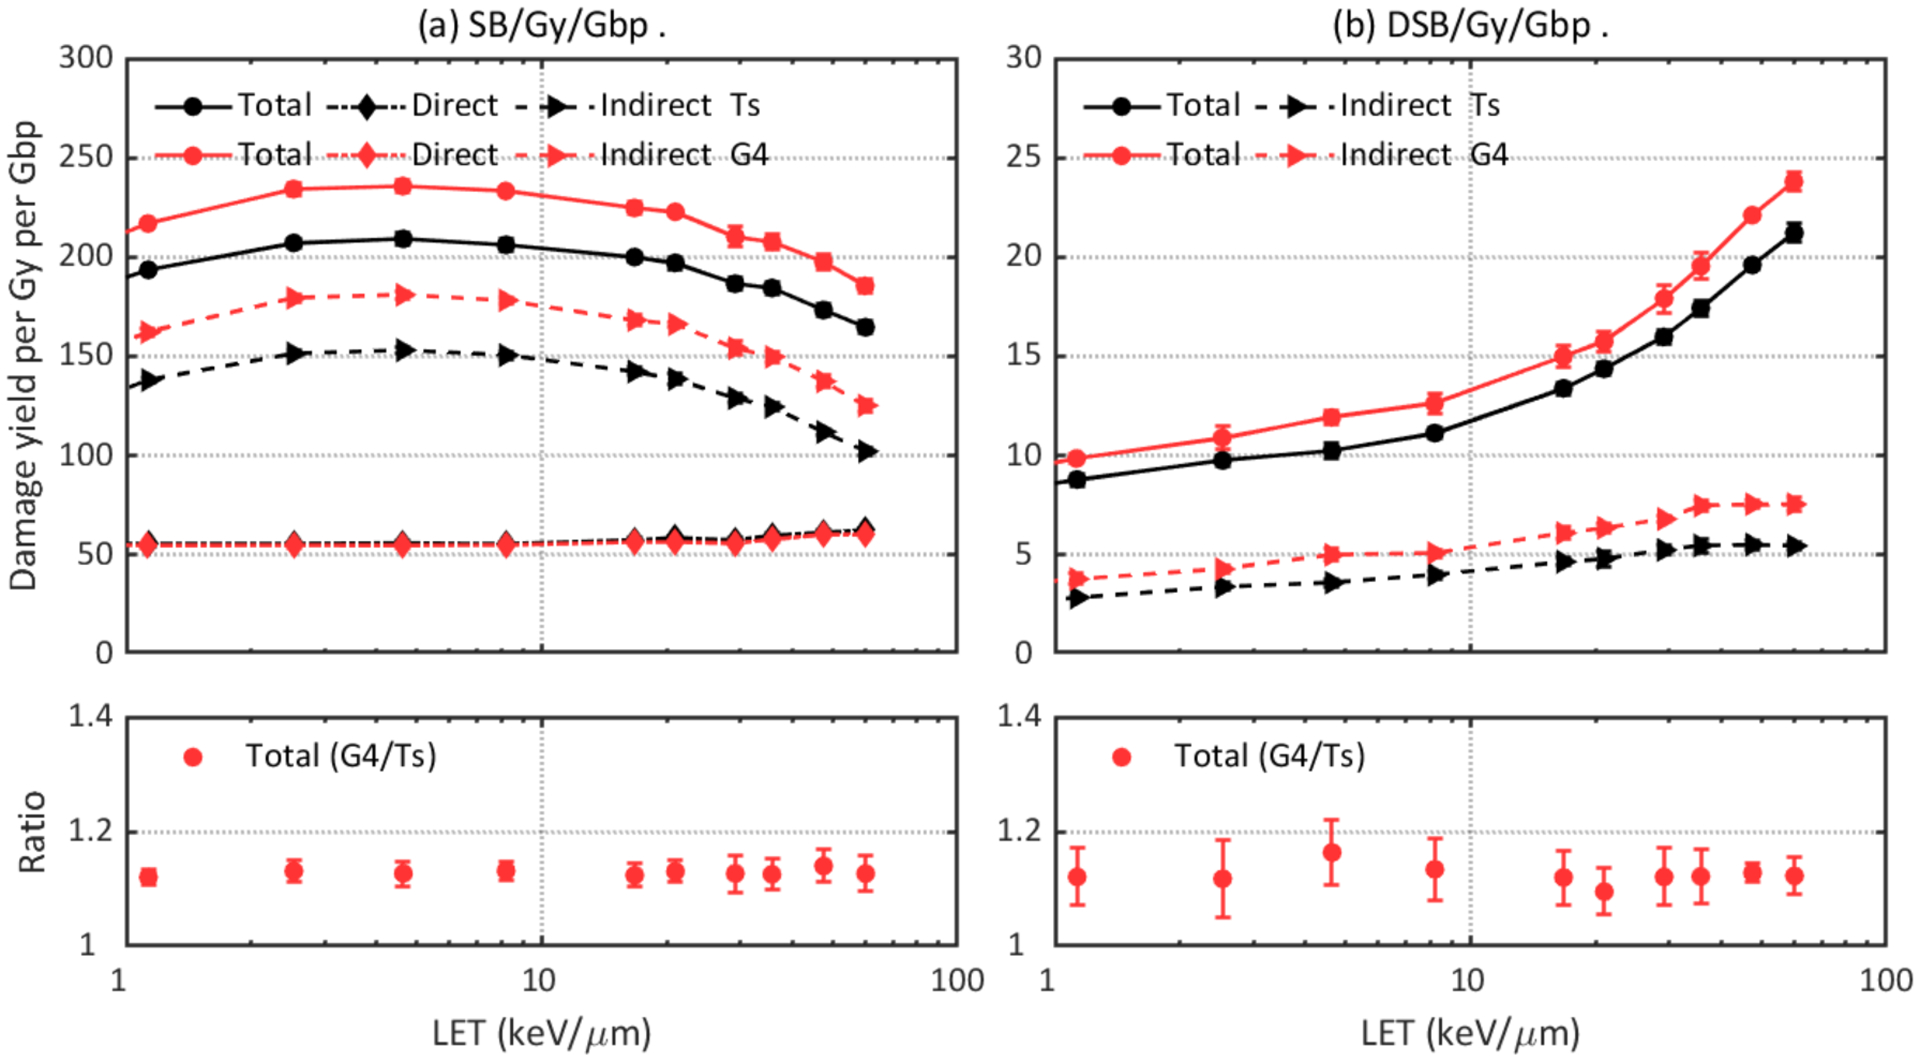
Figure 8.

Comparison of DNA damage yields simulated with different chemistry models: Ts (TsEmDNAChemistry) and G4 (G4EmDNAChemistry). Upper left: total, direct, and indirect SB yields. Lower left: ratio of total SB yields. Upper right: total and indirect DSB yields. Lower right: ratio of total DSB yields.
