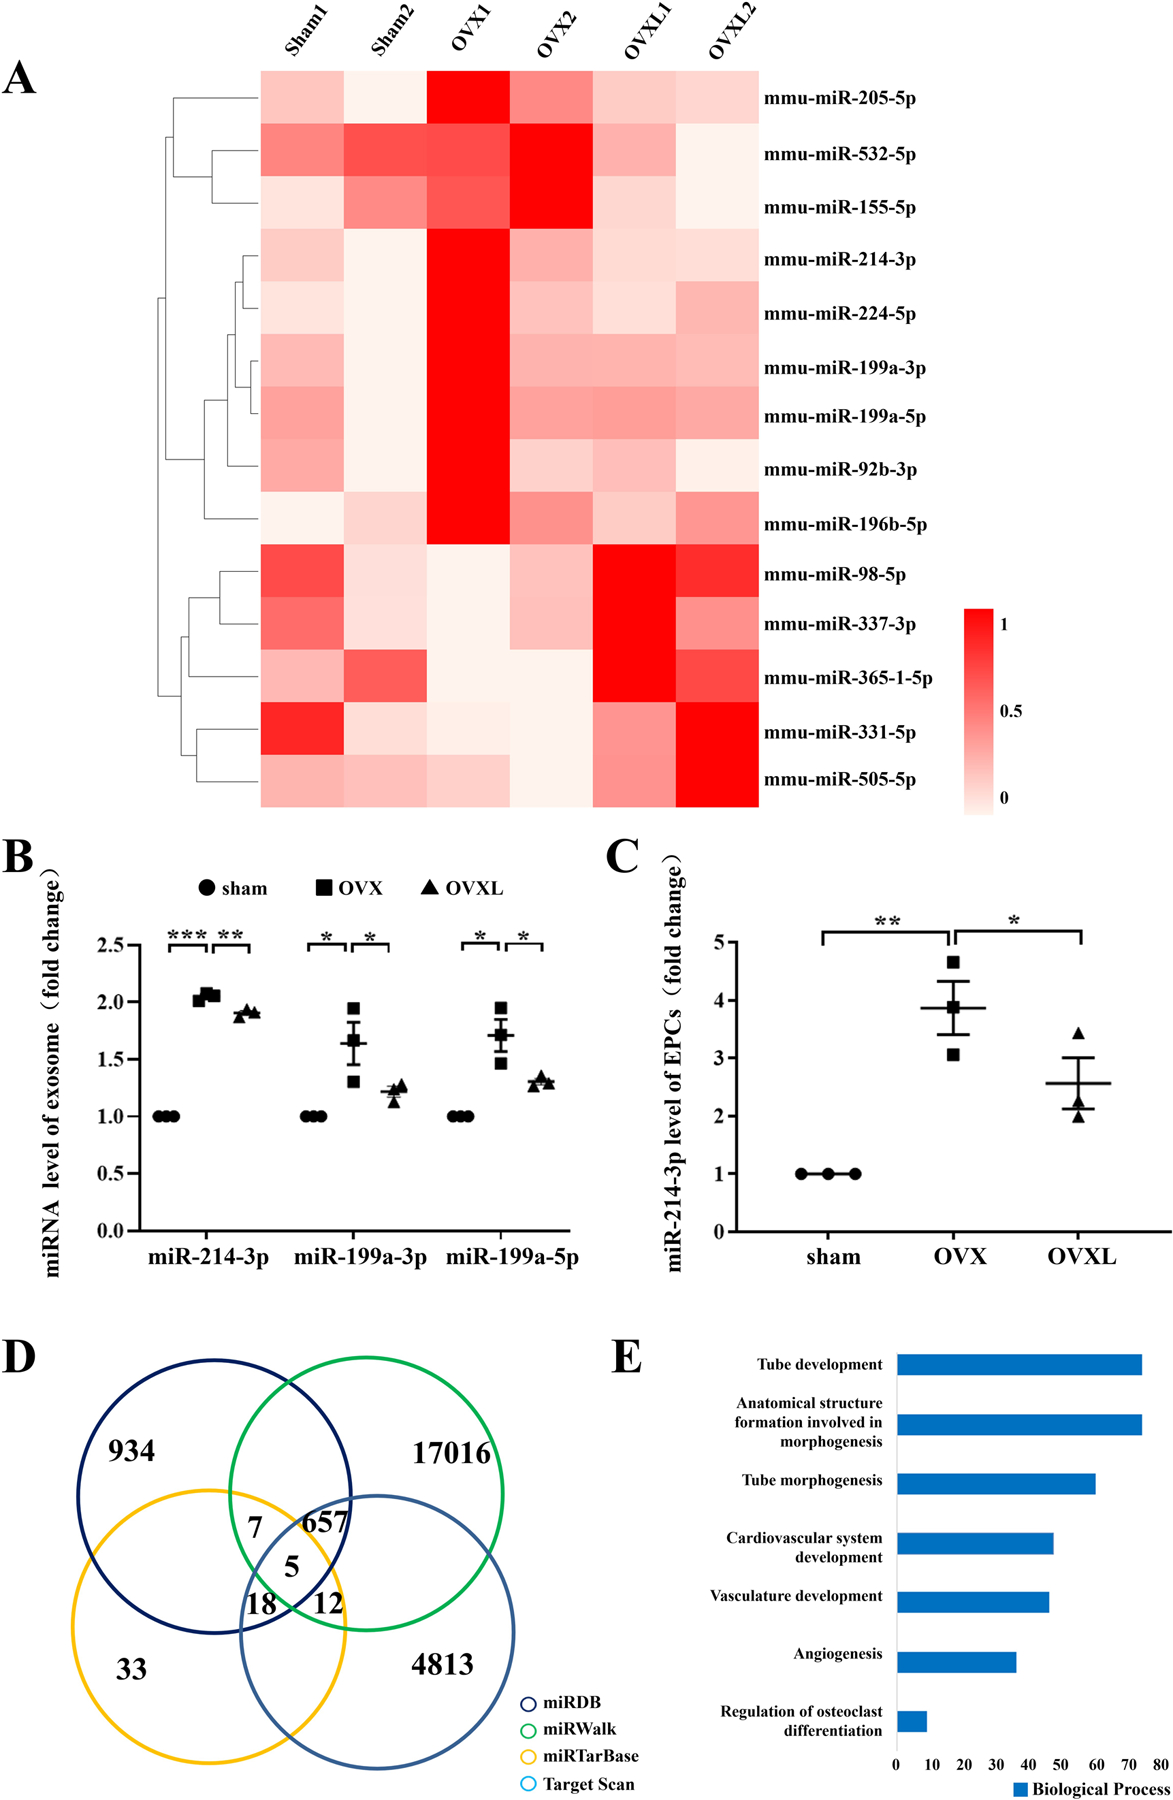
FIGURE 2.

Heat map and bioinformatics analysis of miR-214–3p. A, Heat map of differentially expressed miRNAs. The shade of red indicates the level of expression. B, miRNA expression in BMMSC-exosome. C, miR-214–3p expression in EPCs. n = 3 per group. *P < .05, **P < .01 and ***P < .001. D, Venn diagram of miR-214–3p target genes. The number indicates the predicted target genes. E, GO analysis of target genes for miR-214–3p.
