
FIGURE 3.
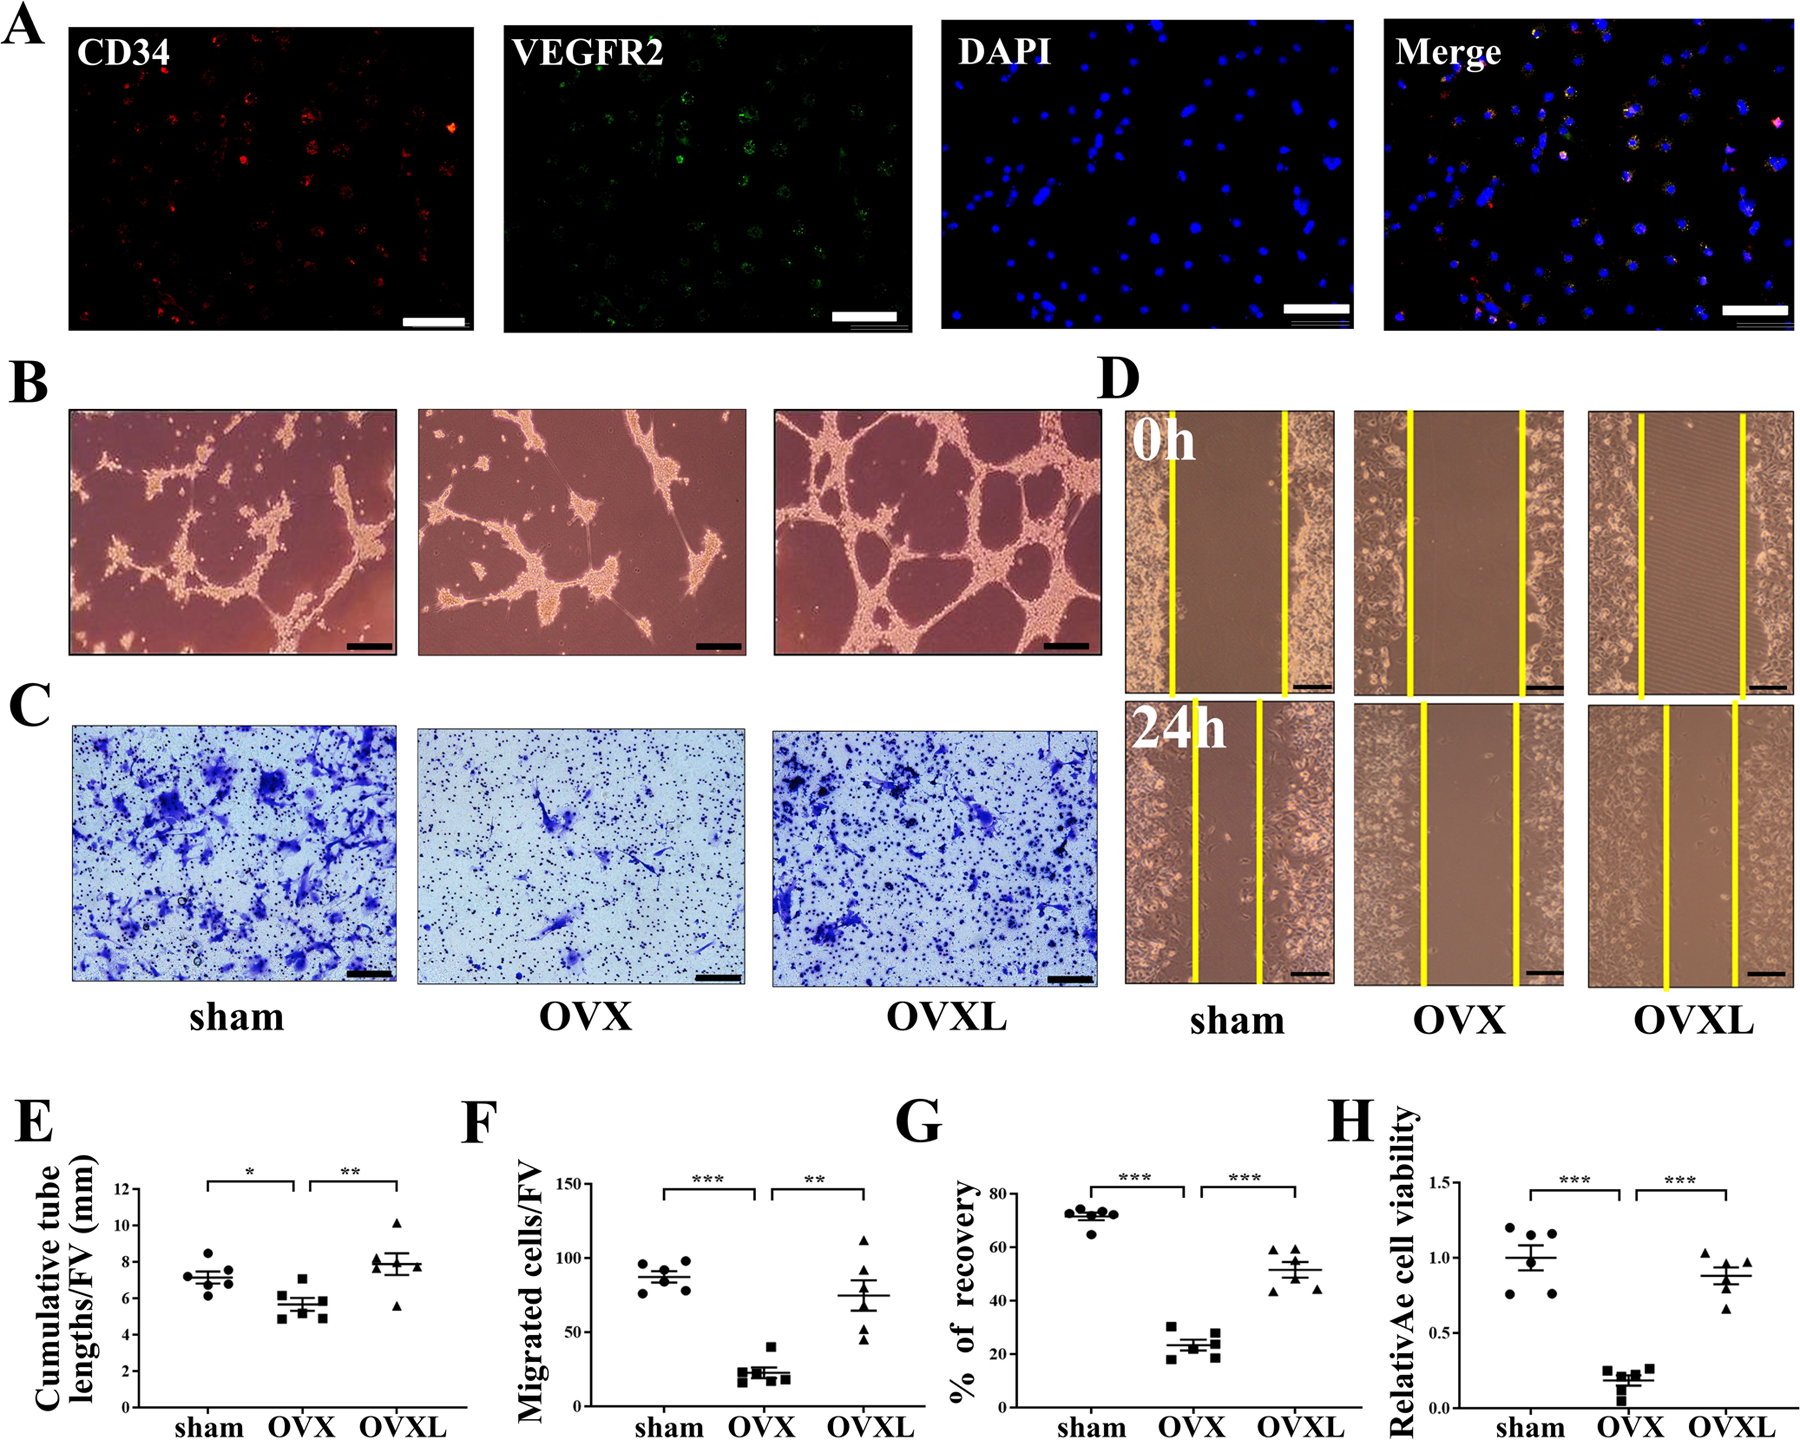
Effect of endothelial progenitor tube formation, cells migration, and wound healing with knee loading in OVX mice in vitro. A, Double immunofluorescence staining of CD34 (red), VEGFR2 (green), DAPI cell nuclei (blue), and CD34, VEGFR2 together with DAPI (merge) on the same cell. Bar = 100 μm. B, Representative images of EPCs tube formation. Bar = 100 μm. C, Representative images of EPCs migration by crystal violet staining. Bar = 200 μm. D, Representative images of EPCs wound healing. Bar = 200 μm. E, Quantitative analysis of cumulative tube lengths. F, Quantitative analysis of EPCs migratory. G, Quantitative analysis of recovery. H, Relative cell viability was evaluated by MTT assay, Quantitative analysis of relative cell viability. Of note, FV, a field of vision. n = 6 per group. *P < .05, **P < .01 and ***P < .001.