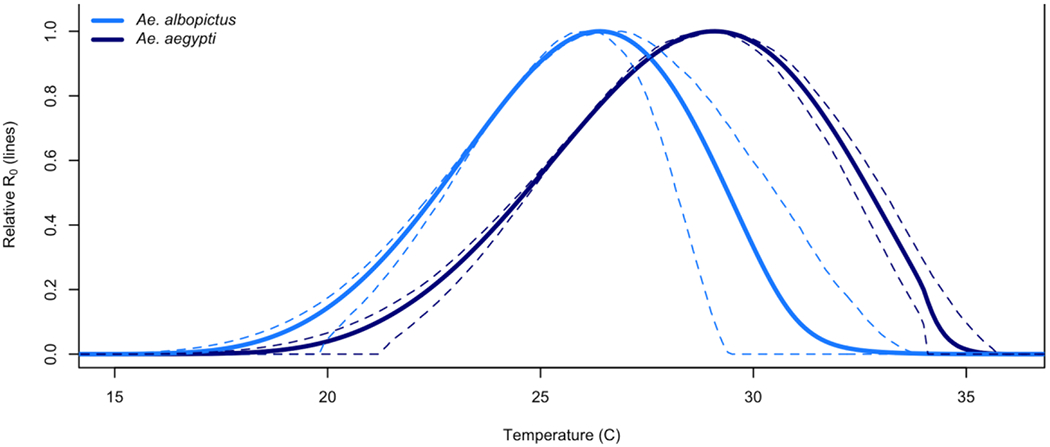
Figure 1:

Temperature dependent transmissibility curves for Ae. aegypti (dark blue) and Ae. albopictus (light blue), with the 95% credible intervals shown as dashed lines, demonstrating the ‘hotter’ transmission suitability of Ae aegypti, and ‘cooler’ suitability for Ae albopictus. Adapted from Figure 2 in Mordecai et al. 2017 (4).
