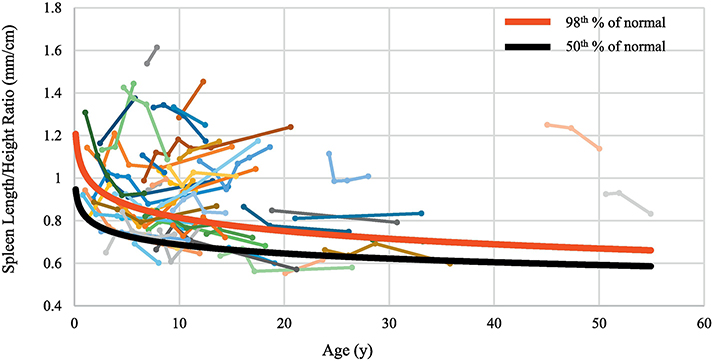
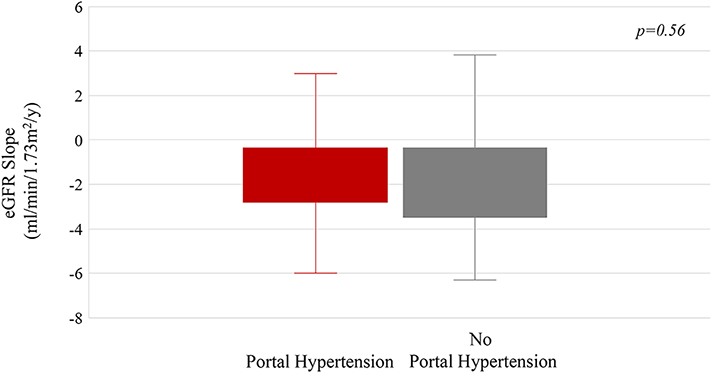
Figure 3. Changes in spleen size as patients with ARPKD grew.
A) Spleen length/height (SL/H) ratio plotted against age. Each group of dots connected by the same color line represents the SL/H ratio of the same patient measured at multiple NIH visits. The red and black lines represent the 98th and 50th percentiles of SL/H ratio in healthy individuals. B) The mean eGFR slopes of patients with and without portal hypertension.


